
flint-chart
🪄 Flint is a visualization language that lets AI agents reliably create expressive, good-looking charts from simple, human-editable chart specs.
Install with your AI
Paste into Claude Code, Cursor, or any agent — it reads the repo and wires the tool into your project.
Install and set up flint-chart (git-clone project) into my current project.
Found on https://claudeers.com/flint-chart
Repo: https://github.com/microsoft/flint-chart
Homepage/docs: https://microsoft.github.io/flint-chart/
Detected install method: git-clone → git clone https://github.com/microsoft/flint-chart
Category: uncategorized. Platforms: cli, api, web.
Read the repo's README for exact setup and env vars, then install it and wire it into my project.

Claudeers Health Verdict:
active; community-verified: false. Confirm the source before running anything.
git clone https://github.com/microsoft/flint-chart
// compatibility
| Platforms | cli, api, web |
|---|---|
| Operating systems | — |
| AI compatibility | claude |
| License | MIT |
| Pricing | open-source |
| Language | TypeScript |
Flint: A Visualization Language for the AI Era
Please visit: Flint Project Site | MCP Server Guide
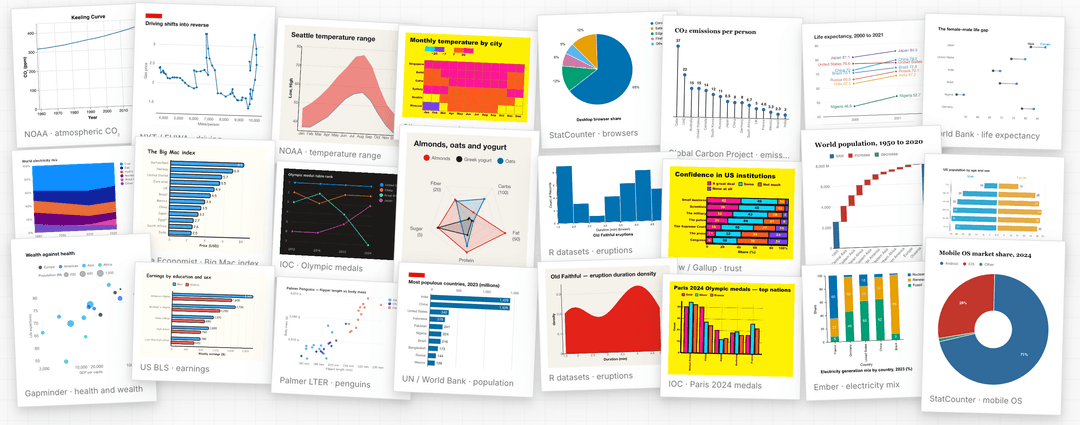
Flint is a visualization intermediate language that lets AI agents create expressive, polished visualizations from simple, human-editable chart specs. Instead of asking agents or developers to tune verbose chart configuration details such as scales, axes, spacing, labels, and layout, the Flint compiler derives optimized chart settings from the data, semantic types, chart type, and encodings. The result is a compact chart specification that agents can produce reliably, people can edit directly, and multiple backends can render as native Vega-Lite, ECharts, or Chart.js specs.
This repo contains two main components:
flint-chart: a JavaScript/TypeScript library that compiles the same Flint input into Vega-Lite, ECharts, or Chart.js specs.flint-chart-mcp: an MCP server that lets agents create, validate, and render charts directly from a chat or coding environment.
Features
- Semantic chart specs. Flint captures what each field means using 70+
semantic types such as
Rank,Temperature,Price, orCountry. - Automatic layout. Flint adapts sizing, spacing, labels, marks, and legends to the data cardinality, chart design, and canvas constraints.
- Multiple backends. Compile one input to 30+ chart types across Vega-Lite, ECharts, and Chart.js, with more to come soon.
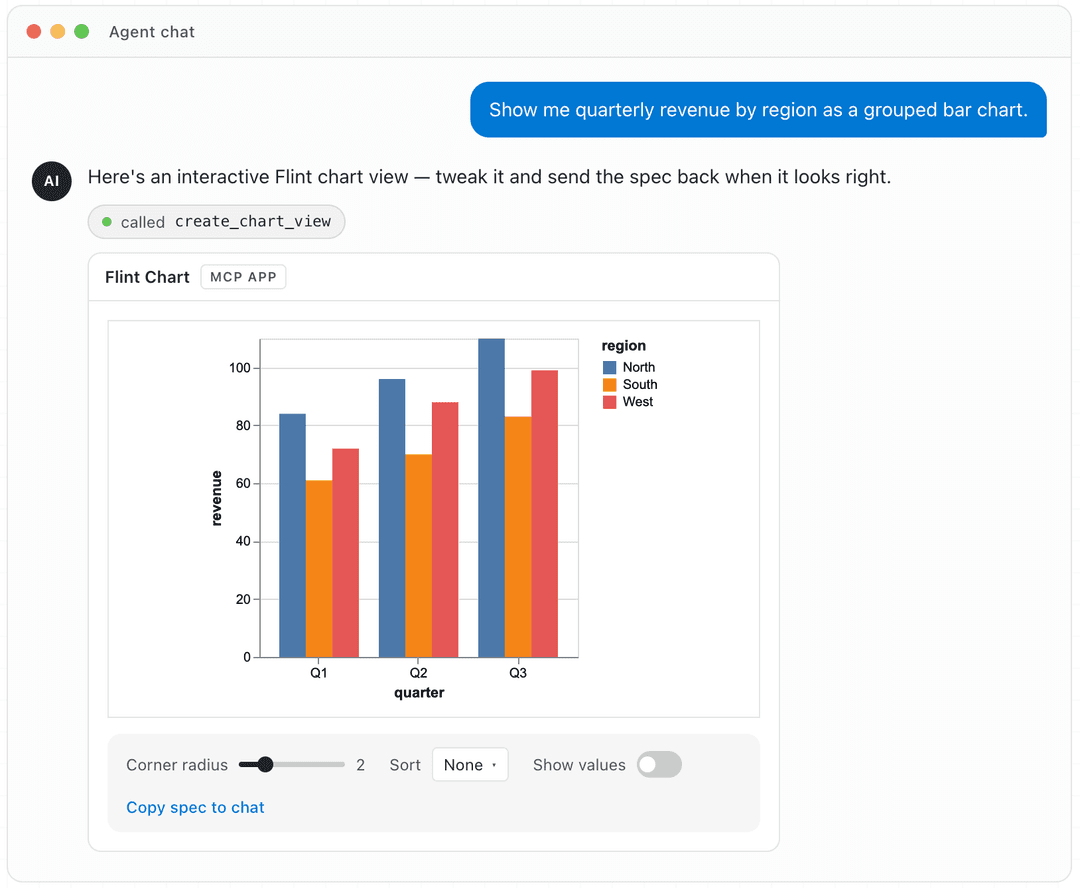
- Agent-ready chart authoring. The MCP server gives agents Flint tools and chart guidance so they can choose a template, validate it, and open an interactive chart view in MCP-capable clients.
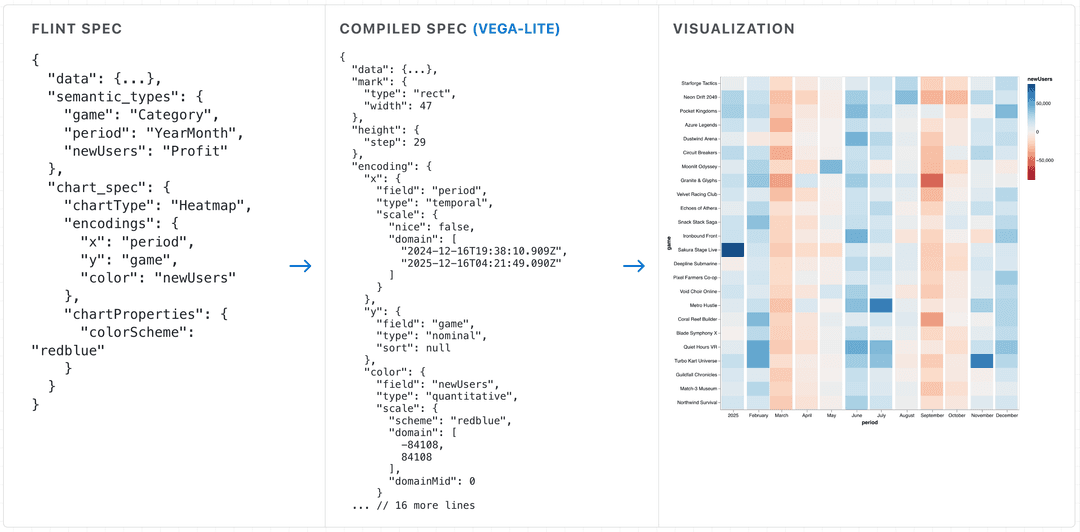
Flint turns compact chart specs into backend-native specs and rendered visualizations.
Install
# Use Flint in your JavaScript/TypeScript codebase
npm install flint-chart

# For agents and MCP clients
npx -y flint-chart-mcp
Python package: to be released. The current Python port is a source-only preview in this repo.
Use Flint As A Library
Every backend accepts the same ChartAssemblyInput and returns the target
library's native spec object.
import { assembleVegaLite } from 'flint-chart';

const spec = assembleVegaLite({
  data: { values: myData },
  semantic_types: { weight: 'Quantity', mpg: 'Quantity', origin: 'Country' },
  chart_spec: {
    chartType: 'Scatter Plot',
    encodings: { x: { field: 'weight' }, y: { field: 'mpg' }, color: { field: 'origin' } },
    baseSize: { width: 400, height: 300 },
  },
});
// → a ready-to-render Vega-Lite spec
Swap the backend without changing the input shape:
import { assembleECharts, assembleChartjs } from 'flint-chart';

const echartsOption = assembleECharts(input);
const chartjsConfig = assembleChartjs(input);
See the API reference, backend references, and live editor for more library examples.
Use Flint As An MCP Server
Install flint-chart-mcp as a Model Context Protocol
server when you want an agent to create charts in the same conversation where
the question starts. It can open an interactive chart view, return static
PNG/SVG output, or produce backend-native chart specs.
For setup, start with the Flint MCP project page. It includes client configuration, usage examples, and links to deeper references.
MCP calls let agents embed rows directly as data.values, or read local JSON,
CSV, or TSV files by data.url. For agent workflows without MCP,
use the standalone agent skill.
Repository overview
flint-chart/
├── packages/
│   ├── flint-js/          npm package `flint-chart` (TypeScript)
│   │   └── src/
│   │       ├── core/      semantics, layout, decisions, shared types
│   │       ├── vegalite/  Vega-Lite backend
│   │       ├── echarts/   ECharts backend
│   │       ├── chartjs/   Chart.js backend
│   │       └── test-data/ fixtures + generators (drive tests and the gallery)
│   ├── flint-py/          Python port preview (package to be released)
│   └── flint-mcp/         npm package `flint-chart-mcp` (MCP render server)
├── site/                  Vite + React demo: landing, gallery, editor, docs
├── agent-skills/          fallback copy of the MCP-served agent skill
├── shared/test-data/      JSON fixtures shared across JS + Python
└── docs/                  architecture and design documents
Documentation
The project site is the main entry point for examples, the live editor, and concept docs. For source-level references, start with the API reference, the Flint MCP project page, or the Development guide.
Contributing
Contributions are welcome! See .github/CONTRIBUTING.md and the Development guide.
git clone https://github.com/microsoft/flint-chart
cd flint-chart
npm install            # root workspaces: packages/flint-js + flint-mcp + site

npm run typecheck      # typecheck packages/flint-js + packages/flint-mcp
npm run test           # Vitest (packages/flint-js + packages/flint-mcp)
npm run build          # build packages/flint-js + packages/flint-mcp
npm run site           # demo site (gallery + editor) at http://localhost:5274/
Node 18+ is required. The demo site aliases flint-chart to
packages/flint-js/src, so library edits hot-reload in the gallery and editor
without rebuilding dist/.
We especially welcome contributions that add new chart templates or new rendering backends.
This project has adopted the Microsoft Open Source Code of Conduct. See SECURITY.md to report vulnerabilities.
Contributor
Flint is built by Microsoft Research in collaboration with the IDEAS Lab, Renmin University of China. We welcome you to join us — see Contributing to get involved.
A research paper describing Flint is coming soon.
Trademarks
This project may contain trademarks or logos for projects, products, or services. Authorized use of Microsoft trademarks or logos is subject to and must follow Microsoft's Trademark & Brand Guidelines. Use of Microsoft trademarks or logos in modified versions of this project must not cause confusion or imply Microsoft sponsorship. Any use of third-party trademarks or logos is subject to those third parties' policies.
License
MIT © Microsoft Corporation
// faq
What is flint-chart?
🪄 Flint is a visualization language that lets AI agents reliably create expressive, good-looking charts from simple, human-editable chart specs.. It is open-source on GitHub.
Is flint-chart free to use?
flint-chart is open-source under the MIT license, so it is free to use.
What category does flint-chart belong to?
flint-chart is listed under uncategorized in the Claudeers registry of Claude-compatible tools.
// embed badge

[](https://claudeers.com/flint-chart)
// retro hit counter

[](https://claudeers.com/flint-chart)
// reviews
// guestbook
// related in Uncategorized / Others
 🔓
🔓Fair-code workflow automation platform with native AI capabilities. Combine visual building with custom code, self-host or cloud, 400+ integrations.
 🔓
🔓The agent engineering platform.
 🔓
🔓FULL Augment Code, Claude Code, Cluely, CodeBuddy, Comet, Cursor, Devin AI, Junie, Kiro, Leap.new, Lovable, Manus, NotionAI, Orchids.app, Perplexity, Poke, Q…
 🔓
🔓100+ AI Agent & RAG apps you can actually run — clone, customize, ship.