
claude-dashboard
Beautiful local dashboard for Claude Code usage — 5h blocks, weekly trends, model & tool breakdown, activity heatmap. Reads ~/.claude logs, no API key.
Install with your AI
Paste into Claude Code, Cursor, or any agent — it reads the repo and wires the tool into your project.
Install and set up claude-dashboard (git-clone project) into my current project.
Found on https://claudeers.com/claude-dashboard
Repo: https://github.com/iftahs/claude-dashboard
Homepage/docs: —
Detected install method: git-clone → git clone https://github.com/iftahs/claude-dashboard
Category: data. Platforms: cli, api, desktop, web.
Read the repo's README for exact setup and env vars, then install it and wire it into my project.

Claudeers Health Verdict:
active; community-verified: false. Confirm the source before running anything.
git clone https://github.com/iftahs/claude-dashboard
// compatibility
| Platforms | cli, api, desktop, web |
|---|---|
| Operating systems | — |
| AI compatibility | claude |
| License | MIT |
| Pricing | open-source |
| Language | TypeScript |
Claude Dashboard
A beautiful, local-first dashboard for your Claude Code usage. It reads the JSON logs Claude Code already writes to ~/.claude and visualizes them — no API key, no account login. Your usage logs never leave your machine.
Two features are optional and opt-in network paths, both privacy-hardened: anonymous product analytics (PostHog — feature-usage events only, switchable off) and AI Insights (sends aggregates only — never transcripts or file paths — to a model you choose). See Privacy & telemetry.
Interactive Features & Tour
The dashboard is organized as a left sidebar with ten destinations. Views are deep-linkable (e.g. /agents, /workflows, /ai), live badges on the sidebar show running agents, the current 5-hour block %, and in-flight workflows, and toast notifications surface update-available, connection, and account-mode notices.
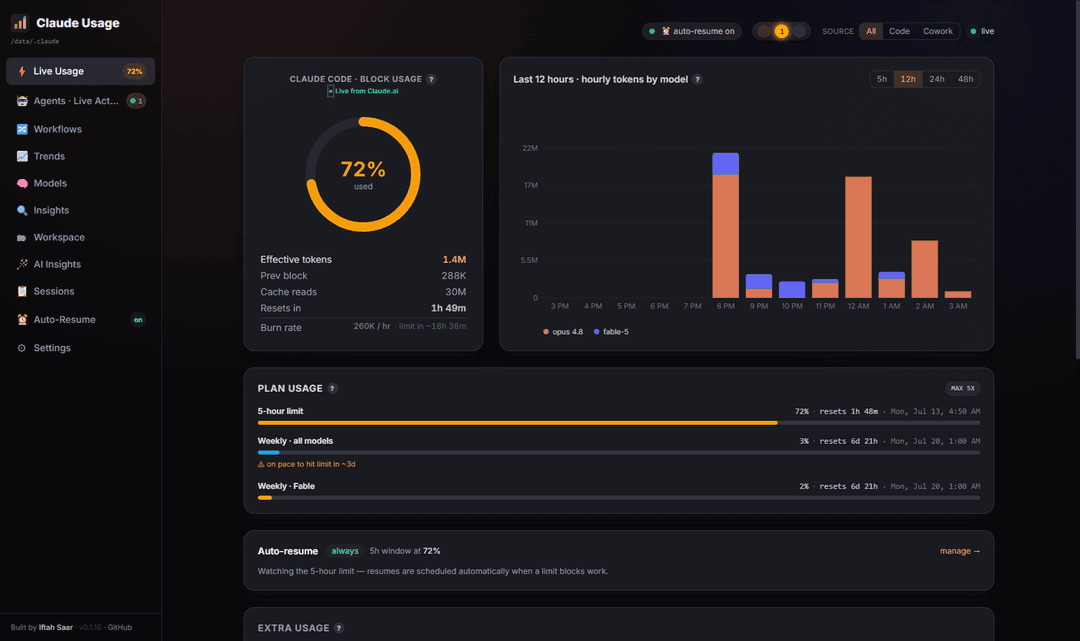
1. ⚡ Live Usage
- Burn Rate Indicator: Shows your current tokens/hour pace and time-to-limit countdown projection.
- Plan Usage: Tracks both your 5-hour active session limit and your weekly limit utilisation percentage, displaying when the next reset will occur.
- Active Session Stats: Breakdown of effective tokens, previous session block sizes, cache reads, and live OAuth connection state from Claude.ai.
- Daily/Weekly/Monthly Spending Limits: Configure client-side spend caps in USD to see consumption progress bars estimated from local logs.
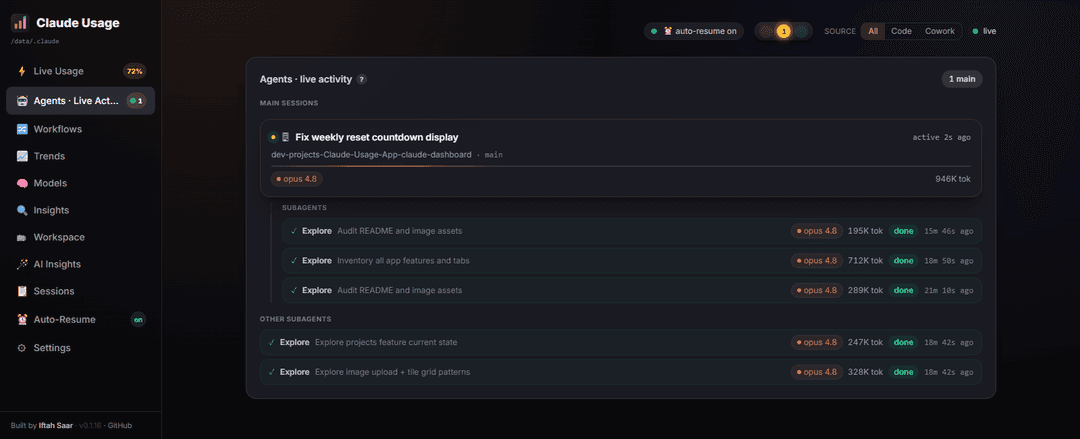
2. 🤖 Agents · Live Activity
Real-time view of what Claude Code is doing right now, reconstructed live from the session transcripts on disk.
- Live Main Sessions: Each active session shows its first prompt, project, git branch, model, and effective tokens, with a sparkline of recent activity.
- Live Subagents: Spawned subagents (Task/Explore/etc.) appear nested under their parent session with their own model and token counts while they run, then settle into a recently-completed state.
- Delegating State: A parent session is marked delegating while its subagents are doing the work.
- Idle Lifecycle: Main sessions dim after 30s of inactivity and drop after 60s; completed subagents no longer keep an idle parent card alive.
3. 🔀 Workflows
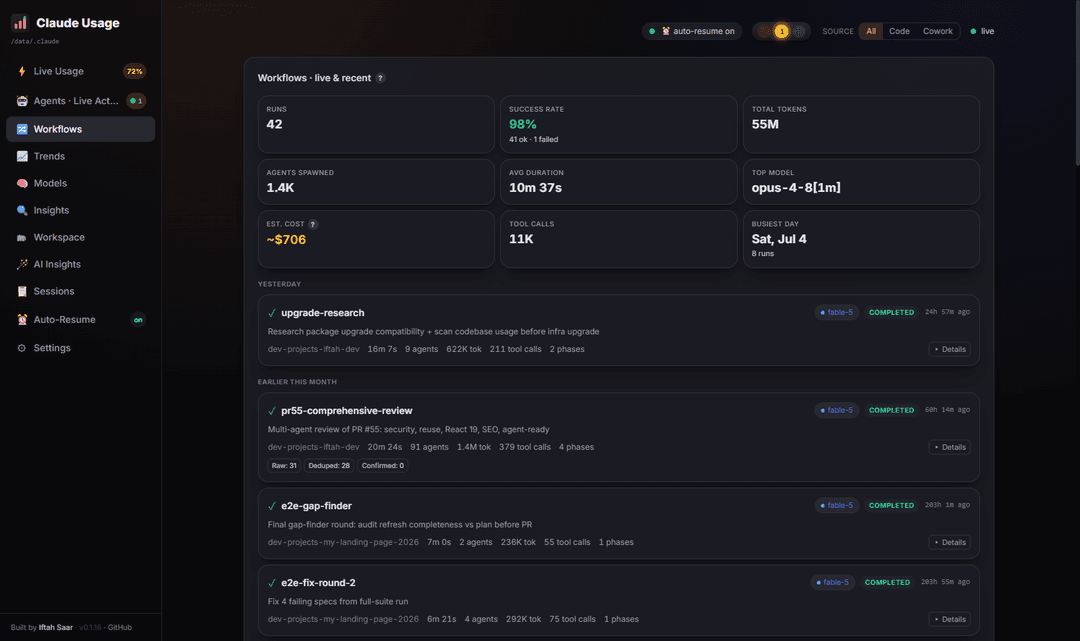
Live and recent dynamic-workflow runs (Claude Code's multi-agent orchestration), so you can watch a fan-out unfold.
- Live Runs: Each running workflow shows its phase progress, per-agent labels with model and token counts, total tokens, and the agent count (including how many are still running).
- Recent Runs: Completed runs from the last several days with status, duration, agents, tool calls, phases, and a result summary you can expand.
4. 📈 Trends
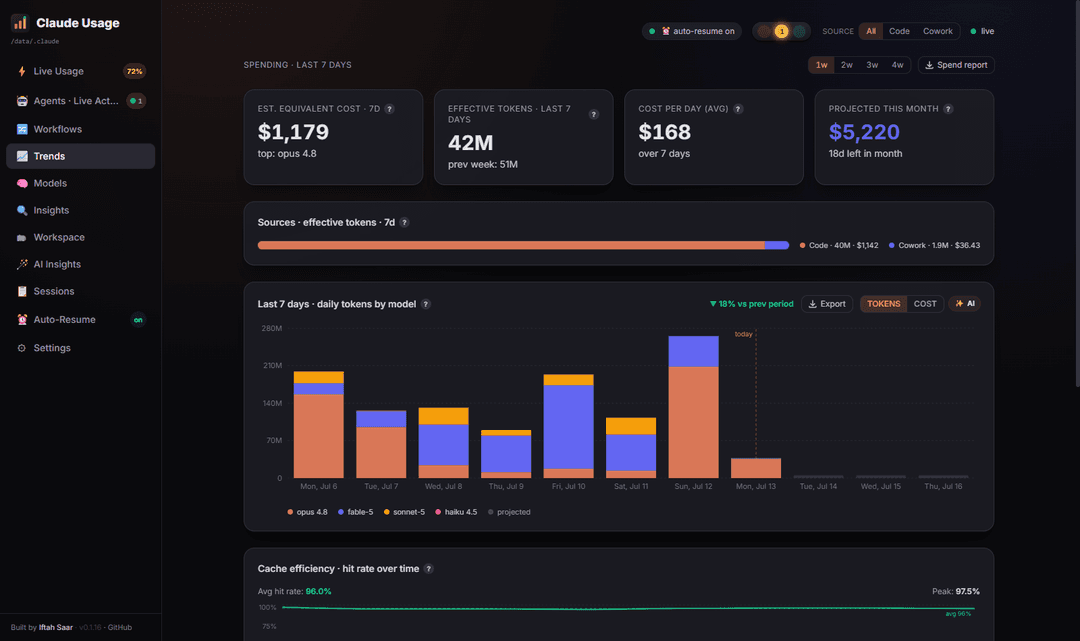
- Tokens vs. Cost Chart Toggle: Click to switch the daily stacked bar chart between Tokens and Cost (USD).
- Estimated Projection: A projected monthly cost reference for the remaining days of the month based on your daily average.
- Cache Efficiency Over Time: Line chart tracking your daily cache hit rate (cache reads / total tokens).
- Peak Hours Heatmap: A 24-column × 7-row intensity grid showing token usage by hour of day and day of week.
- Activity Grid: A GitHub-style daily activity heatmap covering the last 18 weeks.
5. 🧠 Models
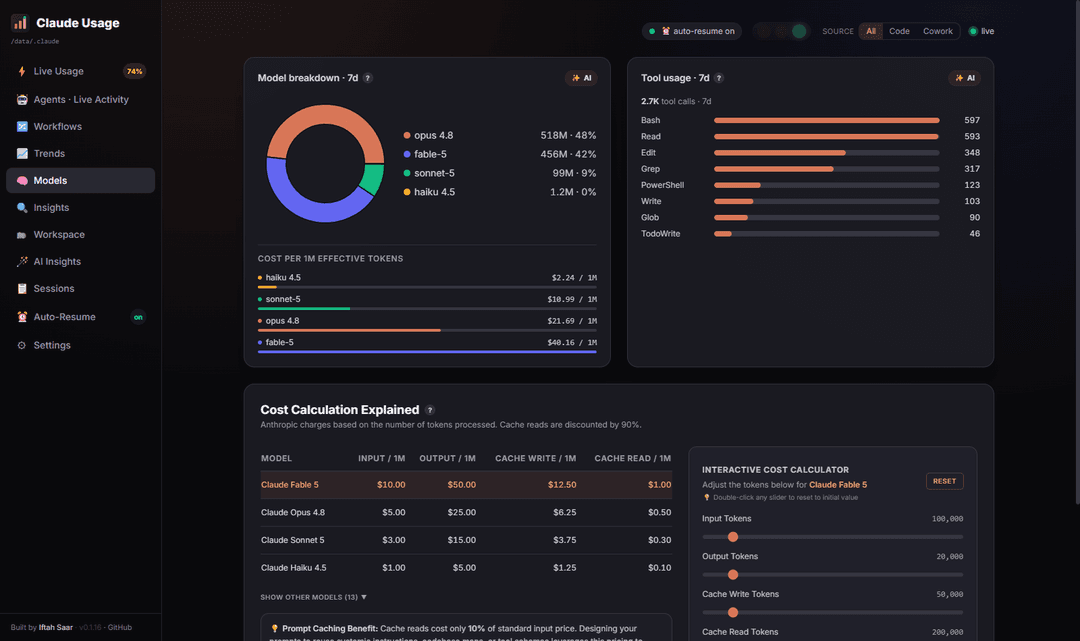
- Model Breakdown: Donut chart showing token share across Opus, Sonnet, and Haiku.
- Model Cost-Efficiency: Horizontal bar chart comparing USD cost per 1M effective tokens for each model.
- Interactive Sandbox Calculator: Calculate costs dynamically from model pricing rules (input, output, cache write, and cache read).
- Tool Usage: Visual breakdown of your most frequently called tools (e.g. Bash, Write, Grep, MCP tools).
6. 🔍 Insights
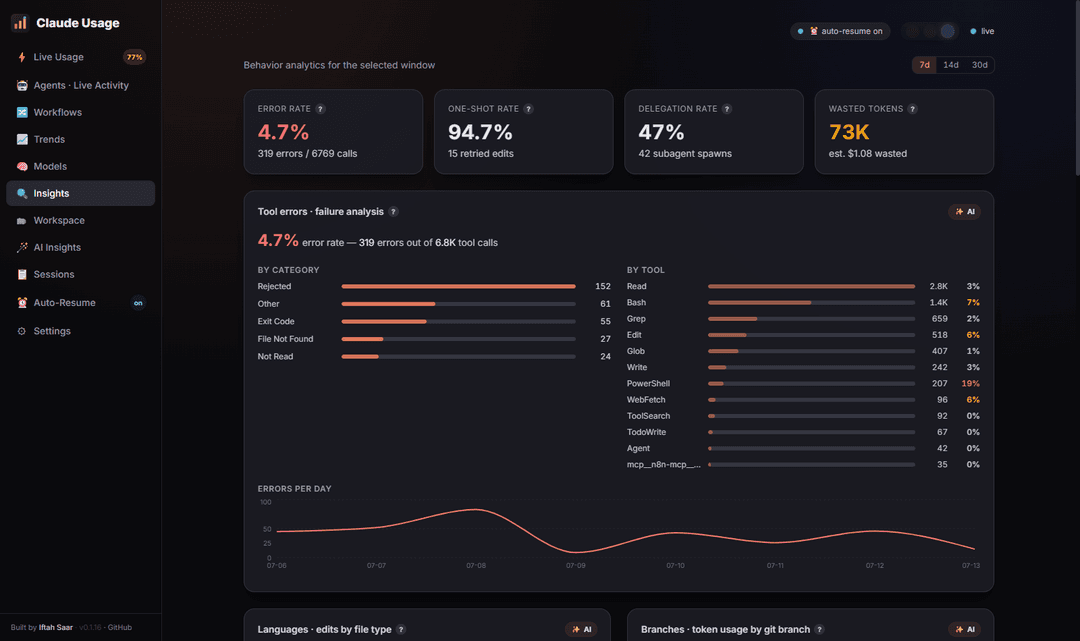
Deep analytics mined from your session transcripts over a selectable window, surfacing patterns you can't see in raw token counts.
- Headline Metrics: Error rate, edit accuracy, delegation rate, and estimated wasted tokens at a glance.
- Tool Errors & Failure Analysis: Which tools fail most and why (by tool, by error type).
- Languages by File Type and Branches by Git Branch: Where your tokens actually go.
- MCP Server Usage and Permission Rejections by Tool: How external tools and gating affect your runs.
- Command Usage and File Churn: Your most-invoked slash commands / skills, and the files you edit most.
- Session Complexity, Yield (Committed vs. Uncommitted), Subagent Delegation, and Edit-Retry / One-Shot Accuracy: Outcome quality across sessions.
7. 🗂 Workspace
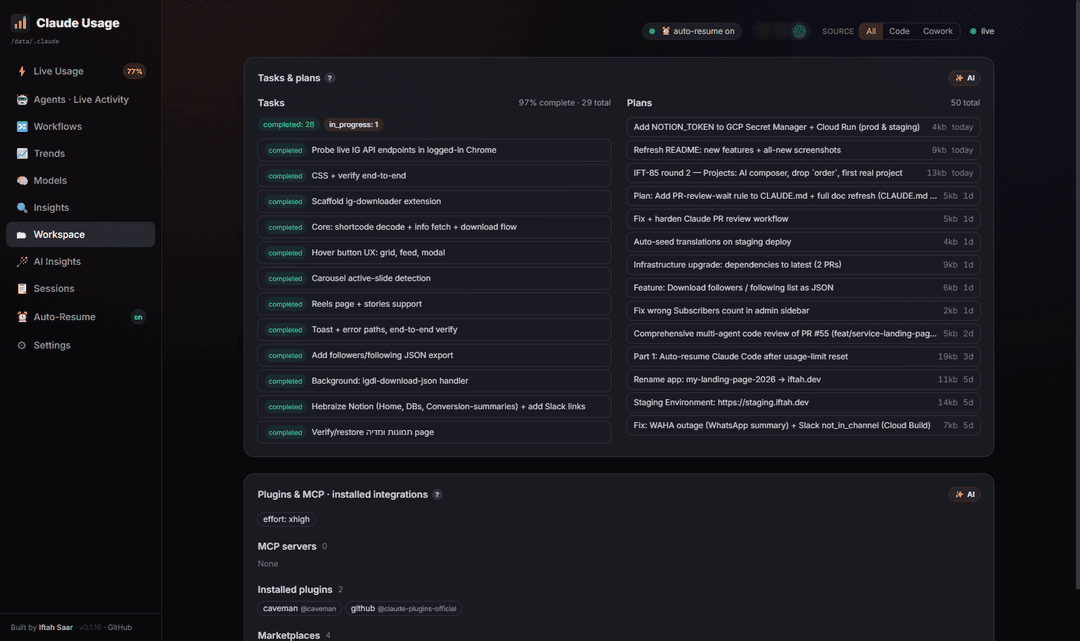
Your Claude Code working state on disk, beyond raw usage.
- Tasks: Counts by status (completed / in-progress / pending / blocked) with completion %, plus the top tasks and any that are blocked.
- Plans: The plan documents under
~/.claude/planswith title, age, and size. - Plugins & MCP Inventory: Installed plugins and marketplaces, configured MCP servers (with scope), hooks, and your effort level / default model.
8. 🪄 AI Insights
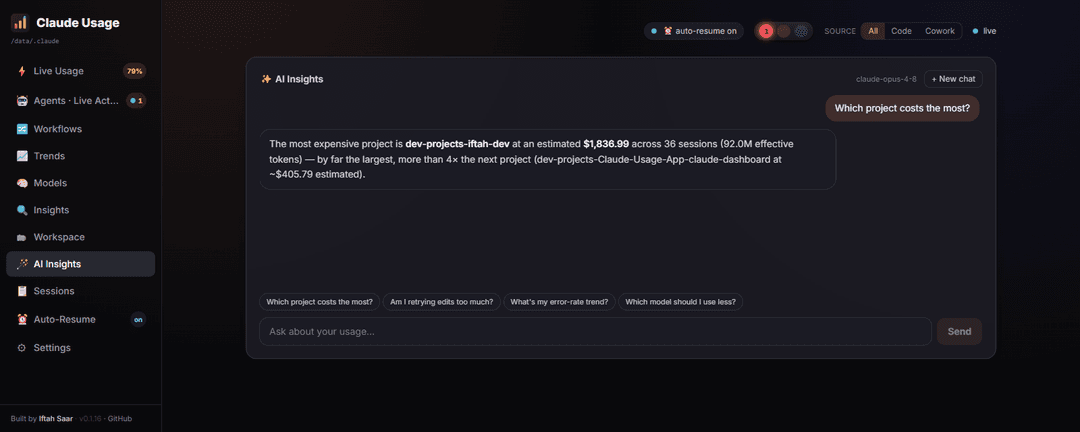
Ask questions about your own usage in plain language, and get per-section explanations on demand.
- Chat: A conversational interface over your usage aggregates (e.g. "which project costs the most?", "am I retrying edits too much?"), with conversation-aware follow-up suggestions. The model only ever sees aggregate metrics — no transcripts, no file paths.
- Per-section ✨ AI: An "✨ AI" button on most panels writes a short plain-language summary of just that chart.
- Bring-your-own backend: Works out of the box with the local
claudeCLI or your Claude.ai token; or set a provider + model + API key (Claude / OpenAI / Gemini) in Settings. See AI Insights privacy.
9. 📋 Sessions
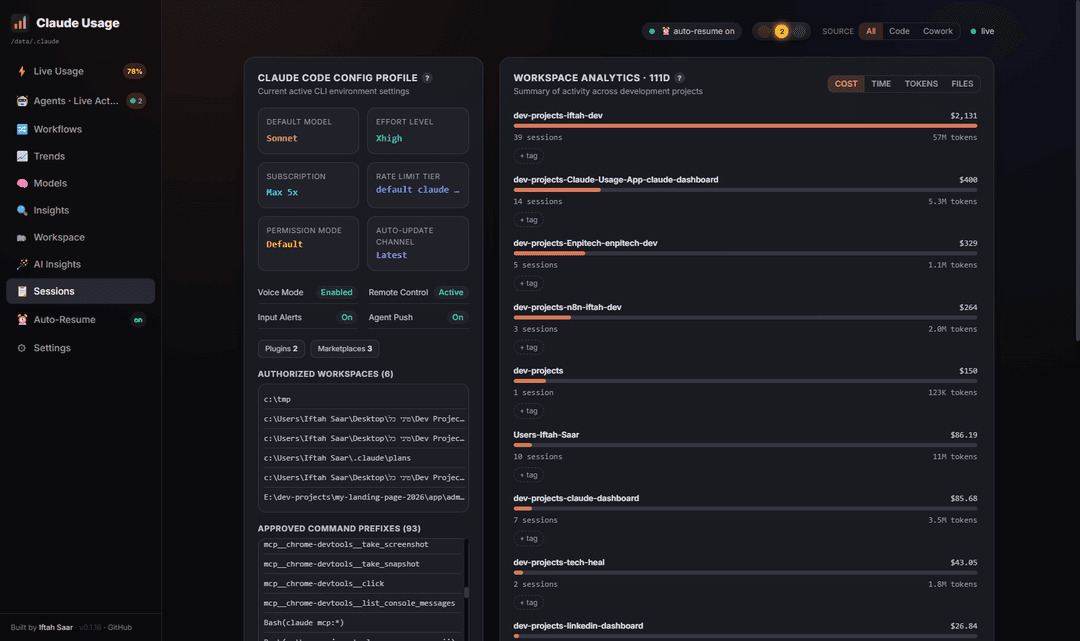
- Config Profile: Your Claude Code config at a glance — default model, effort level, subscription/rate-limit tier, authorized workspaces, and approved command prefixes.
- Workspace Analytics: Ranks estimated costs, tokens, sessions, and files modified across all your project directories. Supported on macOS, Linux, and Windows (with automatic drive-letter and folder normalization).
- Live Session History Log: Rebuilt live from the JSONL transcripts (not stale sidecar files), so it never goes blank. Each row shows start time, project, first prompt, duration, and tokens, and is searchable by project or prompt.
- Detailed Session Expansion: Click any row to drill into message counts, git commits/pushes, lines added/removed, files modified, tool errors, a full tool-invocation breakdown, and a collapsible transcript.
- CSV/JSON Export: Export session logs and trends datasets with a single click.
10. ⚙ Settings
A full-screen settings view (pinned to the bottom of the sidebar) for usage mode (auto / subscription / API), spending limits, AI Insights (provider, model, API key — stored only in your browser), and telemetry opt-out.
A source toggle (Code / Cowork / All) appears in the header only if Claude Cowork data is detected on this machine; Code-only users see the dashboard unchanged.
Quick start
Requires Node.js 20+ (the active LTS — some dependencies require it).
git clone https://github.com/iftahs/claude-dashboard.git
cd claude-dashboard
npm install
npm run dev
Then open the URL Vite prints (default http://localhost:5180). The dashboard populates as soon as you've used Claude Code on this machine.
npm run dev starts two processes via concurrently:
- a small Express backend (port
8787) that scans~/.claudeand serves aggregated JSON, - the Vite dev server for the React UI, which proxies
/apito the backend.
Run with Docker (always-on)
Want the dashboard always available without running npm each time? Run it as a container. It builds the UI, serves everything from one Express process on port 8787, and mounts your ~/.claude folder read-only.
-
Copy the env template and point it at your Claude data folder:
cp .env.example .envEdit
.envand setCLAUDE_DIR_HOSTto your real path (use forward slashes on Windows):CLAUDE_DIR_HOST=C:/Users/you/.claudeTo enable the AI Insights backend in Docker, either set
WITH_CLAUDE_CLI=1(bundles theclaudeCLI so it can runclaude -pagainst your mounted token) or provide anANTHROPIC_API_KEY— both are documented in.env.example. You can also just set an API key at runtime in ⚙ Settings instead. -
Build and start:
docker compose up -d --build -
Open http://localhost:8787.
The container uses restart: unless-stopped, so it comes back automatically after a crash or reboot (as long as Docker Desktop is set to start on login). Stop it with docker compose down. To change the host port, edit the ports mapping in docker-compose.yml (e.g. "9000:8787").
Changing the Claude data folder
By default the backend reads from your home directory:
| OS | Default path |
|---|---|
| Windows | C:\Users\<you>\.claude |
| macOS / Linux | ~/.claude |
This is detected automatically — the path shown in the dashboard header is just your machine's home folder at runtime. If your logs live somewhere else (a custom install, a backup, another user's export), point the backend at it with the CLAUDE_DIR environment variable:
macOS / Linux
CLAUDE_DIR="/path/to/.claude" npm run dev
Windows (PowerShell)
$env:CLAUDE_DIR = "D:\backups\.claude"; npm run dev
Windows (cmd)
set CLAUDE_DIR=D:\backups\.claude && npm run dev
To change the backend port, set SERVER_PORT (default 8787). If you change it, update the proxy target in vite.config.ts to match.
What this dashboard can and can't show
It reflects only what Claude Code records locally. Two things deliberately are not shown because they don't exist in the local logs:
- The exact rate-limit reset time and remaining quota — those live in Anthropic API response headers, which Claude Code doesn't persist to disk. Any countdown would be a guess, so it's omitted.
- Claude.ai web usage — that's server-side per-conversation and never written to
~/.claude.
You can set a personal token cap in ⚙ Settings to see a "% used" gauge — that compares your real measured usage against a number you enter.
Privacy & telemetry
Your Claude usage data — logs, tokens, project paths, session contents — never leaves your machine. The only network calls the dashboard makes for your data reuse the OAuth token Claude Code already stores locally to read live usage and your plan from Anthropic. Beyond that, exactly two optional, opt-in paths reach the network:
Anonymous product analytics
The app sends anonymous product-analytics events to PostHog so the author can see how many people use the dashboard and which features matter. This is deliberately minimal and privacy-hardened:
- What's sent: which tab is opened, exports, source-toggle/range changes, an anonymous install count, and a coarse plan/usage-mode label.
- What's never sent: OAuth tokens, file or project paths, project names, session IDs, transcript content, or any personal data. Browser autocapture and session replay are turned off so the UI's on-screen paths can't be scraped.
- Opt out any time:
- In the app: ⚙ Settings → Telemetry → Disable anonymous analytics (takes effect immediately, persisted in your browser).
- At build time: build with
VITE_DISABLE_ANALYTICS=1(set it in.envfor Docker — see.env.example) for a fully telemetry-free image.
- Analytics is also disabled automatically in local dev builds.
AI Insights (opt-in)
The AI Insights tab and the per-section "✨ AI" buttons call a model only when you ask (open the tab, send a message, or click a button). What's sent is a privacy-safe aggregate summary — weekly totals, top models/tools/projects (project basenames only), error/retry/delegation rates, and similar metrics.
- What's never sent: transcripts or message contents, full file/project paths, session IDs, or your OAuth token.
- Which backend serves the call (first available wins): an API key you set in ⚙ Settings → AI Insights (Claude / OpenAI / Gemini, stored only in your browser) → a server-side
ANTHROPIC_API_KEY→ the localclaudeCLI (claude -p, uses your subscription) → your Claude.ai OAuth token → otherwise the feature shows setup instructions and does nothing. - Server-side defaults for Docker/self-host live in
.env.example:WITH_CLAUDE_CLI=1,ANTHROPIC_API_KEY, andAI_MODEL(defaultclaude-opus-4-8). - If you never open the AI tab or click "✨ AI", no aggregates are ever sent.
Contributing
Contributions welcome! This is an open project:
- Found a bug or have an idea? Open an issue.
- Want to change something? Fork the repo, create a branch, and open a pull request.
The main branch is maintained by the author; all external changes go through pull requests.
License
MIT — free to use, modify, and distribute for everyone.
Credits
Built by Iftah Saar — iftah.dev.
// faq
What is claude-dashboard?
Beautiful local dashboard for Claude Code usage — 5h blocks, weekly trends, model & tool breakdown, activity heatmap. Reads ~/.claude logs, no API key.. It is open-source on GitHub.
Is claude-dashboard free to use?
claude-dashboard is open-source under the MIT license, so it is free to use.
What category does claude-dashboard belong to?
claude-dashboard is listed under devtools in the Claudeers registry of Claude-compatible tools.
// embed badge

[](https://claudeers.com/claude-dashboard)
// retro hit counter

[](https://claudeers.com/claude-dashboard)
// reviews
// guestbook
// related in Data & Analytics
 🔓
🔓Wrap Antigravity, ChatGPT Codex, Claude Code, Grok Build as an OpenAI/Gemini/Claude/Codex compatible API service, allowing you to enjoy the free Gemini 3.1 P…
 🔓
🔓Marketing skills for Claude Code and AI agents. CRO, copywriting, SEO, analytics, and growth engineering.
 🔓
🔓Apache Airflow - A platform to programmatically author, schedule, and monitor workflows
 🔓
🔓CLI tool for configuring and monitoring Claude Code