
rungraph
Ask your agent what happened in a run — it answers in your terminal and lights up the exact nodes on an open graph. Claude Code, Codex, Hermes.
Install with your AI
Paste into Claude Code, Cursor, or any agent — it reads the repo and wires the tool into your project.
Install and set up rungraph (npm project) into my current project.
Found on https://claudeers.com/rungraph
Repo: https://github.com/fayzan123/rungraph
Homepage/docs: —
Detected install method: npm → npm install rungraph
Category: mcp-servers. Platforms: cli, api, web.
Read the repo's README for exact setup and env vars, then install it and wire it into my project.

Claudeers Health Verdict:
active; community-verified: false. Confirm the source before running anything.
npm install rungraph
git clone https://github.com/fayzan123/rungraph
// compatibility
| Platforms | cli, api, web |
|---|---|
| Operating systems | — |
| AI compatibility | claude |
| License | MIT |
| Pricing | open-source |
| Language | JavaScript |
rungraph
Ask your agent what happened. Watch the graph answer. — fayzan123.github.io/rungraph embeds a real run you can click around, right in the page.
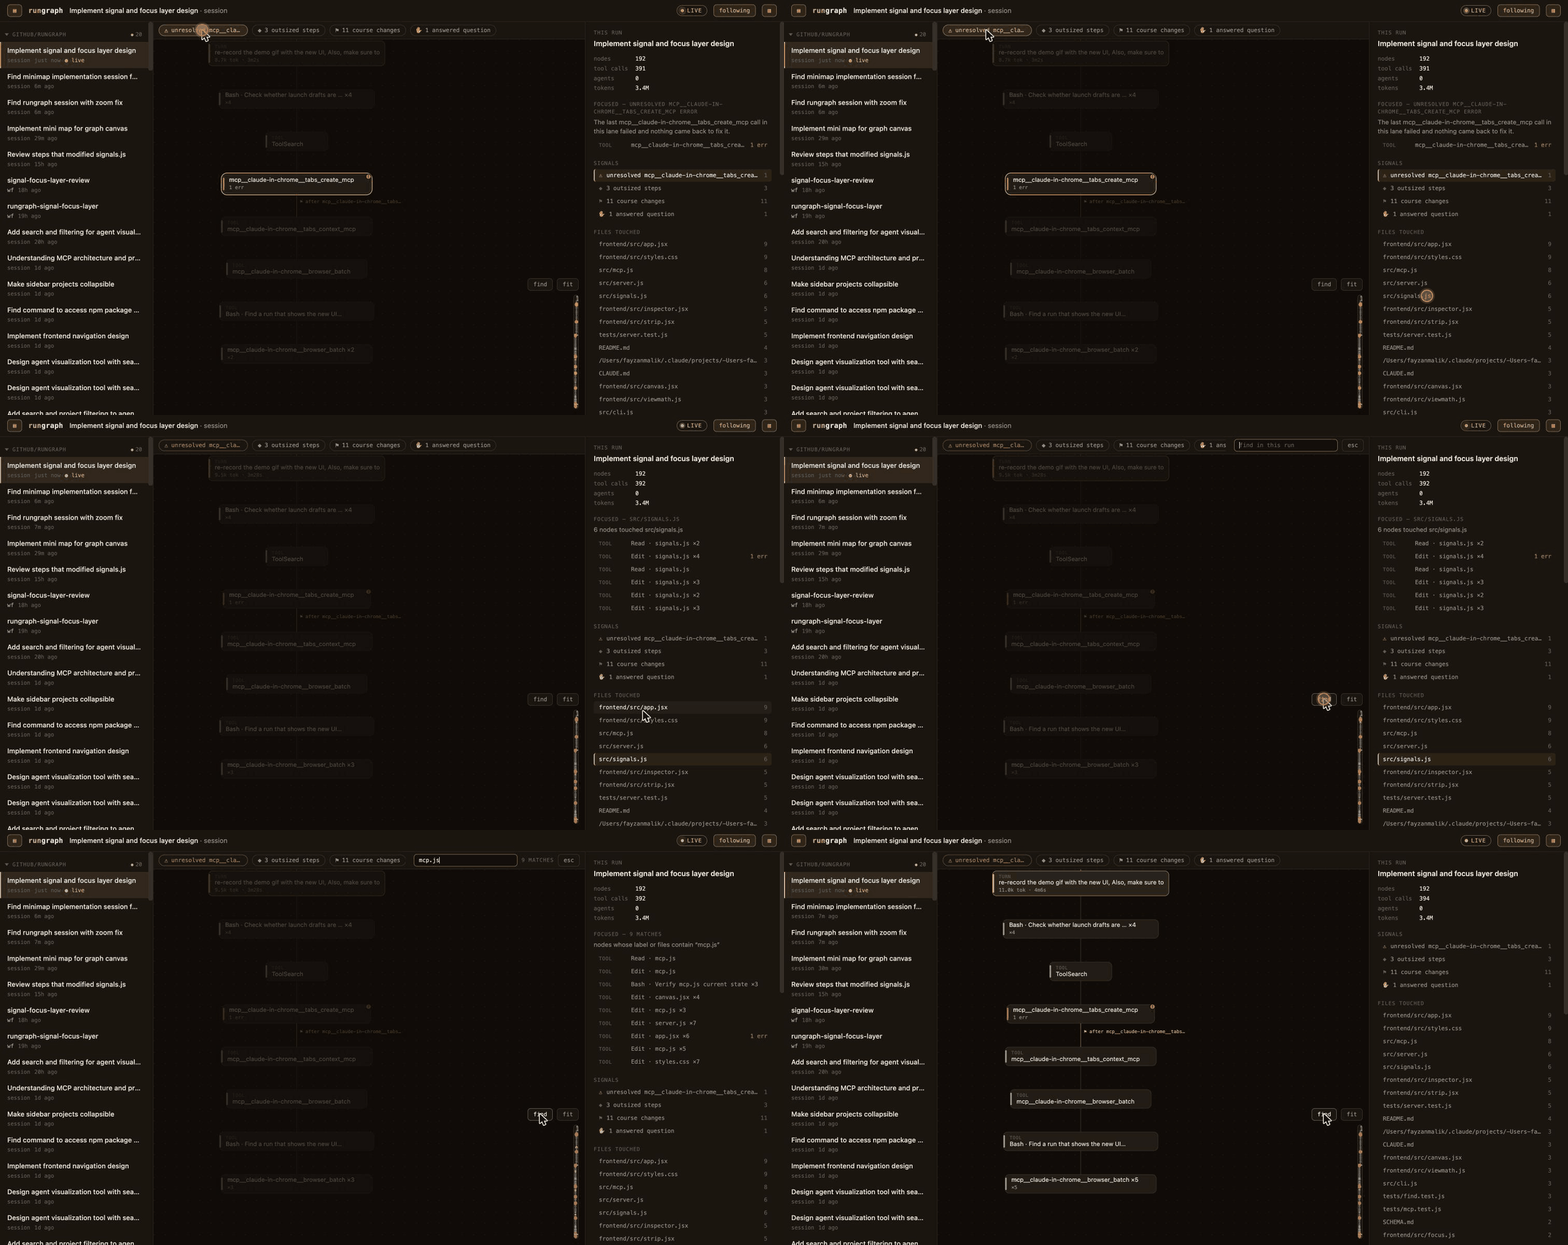
That's rungraph watching the live session that built this feature — the strip says what went wrong, and one click lights up the nodes it means.
Your coding agent already wrote down everything it did. rungraph reads those
transcripts — and hands your agent the tools to read them too. You ask in your
terminal: "why did the Edit on token.js keep failing?" The answer arrives
there, in your own session, from your own model, fully inspectable. Then the
graph you have open lights up the exact nodes the answer is about, and
hands back a link that reopens that view for anyone you send it to. See
Ask your agent about a run.
npx rungraph
That's the whole quickstart. It scans ~/.claude/projects, ~/.codex/sessions,
~/.hermes and ~/.local/share/opencode — Claude Code, Codex, Hermes Agent and
opencode runs — starts a local server, and opens your browser. Pick a run —
including one that's running right now: the graph grows live as the agent
works (file watching only). (Hermes and opencode runs need Node ≥ 22.13 for the
built-in SQLite reader; on older Nodes they're skipped with a warning and
everything else works.)
What you get is an interactive directed agentic graph — orchestrator, subagents, and tools as nodes; spawn/return relationships as edges; the course-change moments (denials, answers, retries) marked on the path. It works retroactively, on every session still on your disk: no hooks, no wrappers, no setup, no telemetry.
New here? docs/GUIDE.md walks through the whole thing — reading the graph, what each signal means, wiring it to your own agent, and what to do when something looks broken.
What you see
Agent sessions stopped being conversations a while ago. They're runs: an orchestrator spawning subagents, workflows fanning out reviewers, tools failing and retrying, a human occasionally saying no. rungraph draws that structure so a 4,000-line transcript becomes something you can actually read:
- Time flows down. Your prompts are the backbone; parallel agents fan out into side-by-side lanes and return to the turn that collected their result.
- Tool nodes say what ran, not just which tool:
Bash · npm test ×12,Edit · canvas.jsx,Grep · waitForURL. Consecutive calls of the same tool collapse into one node so a test-fix loop doesn't become a hairball. - Click any node for the full story: prompt and response for turns; every call's inputs, outputs, errors, and timing for tools; the complete transcript for subagents. Tool nodes also show the why — the agent's own narration from just before the call ("Now I'll rerun the tests to check…").
- Human interventions are first-class nodes. A denied permission, an
answered question, a mid-turn interrupt — these are the moments a run
changes direction, and the edges that follow them carry the reason
(
after permission denial,retry after failure,after Bash error). - Workflow runs (multi-agent orchestrations) appear as single nodes you can drill into: their own graph, phase boxes and all, retries linked to the attempts they replaced.
- Tokens, durations, and models annotate nodes; whole-run totals in the header.
What went wrong
A graph that renders everything with equal weight points at nothing: a two-second file read and a forty-minute retry spiral look identical. So rungraph has an opinion. It derives signals from the run and puts them in a strip above the canvas — and on a clean run that strip costs zero height, because a marker you can't trust is worse than no marker.
| fires when | |
|---|---|
| ⟳ retry storm | the same tool kept failing in one place — Edit fails, the agent reads the file, Edit fails again |
| ⚠ unresolved error | something failed and nothing ever came back to fix it |
| ✋ intervention | you denied a permission, interrupted a turn, or answered a question |
| ◆ outlier | a step that cost far more tokens or wall-clock than the rest of the run |
| ⚑ course change | the run's own recorded lineage for why it changed direction |
Click a signal and the graph focuses: those nodes light up, everything else
dims to a quarter — dimmed, never hidden, so the shape you already memorized
stays put. Esc or a click on empty canvas clears it.
The same focus mechanism backs everything else that points at nodes:
- Find (
/) — plain substring over node labels and the files each node touched. No model, no network, no subprocess; it filters in the browser. - Files — tool and agent nodes carry the paths they touched, including work done inside subagents, which is where a lot of real editing happens. The inspector lists every file the run touched with a count; click one to see exactly which steps touched it.
- Live escalation — signals are re-derived on every live-tail update. Go do something else while the agent works; the strip goes loud only when something new has actually gone wrong.
…and what rungraph couldn't read
An empty strip is a claim, and it is only worth something if rungraph actually read the run. Transcript formats are undocumented and unversioned: a vendor ships a release, adds a record type, and a run quietly starts arriving with holes in it. Nothing about that shows up in the signals — they can only speak about records that parsed.
So every run also carries coverage: how many records rungraph examined and
how many it could not interpret. The inspector shows it on every run, always
(records 1075 / 1075), and the strip says read 95% of this run when
something went unread on a run that otherwise looks clean — louder when most of
the run is missing. Below 100% it also names the record types it did not
understand, because "one unknown metadata type" and "four hundred missing
assistant turns" are the same percentage and opposite emergencies. Your agent
gets the same numbers and is told to say so before calling a run clean.
Ask your agent about a run
The dashboard is for you; the MCP server is for your agent. They are two ends of one loop, not two products.
npx rungraph mcp --install     # one time, then restart Claude Code
npx rungraph mcp --check       # is it working? prints exactly what to fix
The server is plain MCP over stdio, so any MCP-capable agent can wire it — not just Claude Code. Hermes, for example:
hermes mcp add rungraph --command npx --args -y rungraph mcp
opencode closes the same two-ended loop — ask in its TUI, get answered there, watch the dashboard light up — and rungraph prints exactly what to add:
npx rungraph mcp --install --client opencode
That one is a paste rather than a command, and the reason is opencode's, not
rungraph's: opencode mcp add is an interactive TUI wizard with no flags, so
there is nothing to delegate to. rungraph prints the mcp block for your
~/.config/opencode/opencode.jsonc and the AGENTS.md line that makes opencode
call focus_nodes after it answers — and writes nothing, because opencode's
config files are JSONC (comments are legal) and rewriting one without a JSONC
parser would destroy them. --client is never guessed: a machine with both
agents installed has no right answer to sniff for. (opencode reads AGENTS.md
first and CLAUDE.md as a compat path, unless OPENCODE_DISABLE_CLAUDE_CODE is
set — so an existing CLAUDE.md line already reaches it.)
Then start a new session and ask the same questions. The tool names
(list_runs, find_nodes, get_graph, get_detail, focus_nodes,
get_current_view, open_visualization) are identical on every agent, and
so is the loop: the agent answers in your terminal, then calls focus_nodes
and the open graph lights up the nodes it's talking about. (If your agent's
Hermes/opencode runs are missing, your default Node is older than 22.13 — point
--command at a Node ≥ 22.13 npx and they appear.)
Then ask, in Claude Code, the kinds of questions a transcript can actually answer:
- which edits in my last run failed — and did any stay broken?
- which steps touched
src/auth.js, subagents included? - what did the "audit auth module" agent find?
- what was the actual error behind that red node?
- did it actually run the tests, or just say it did?
Claude calls find_nodes / get_graph / get_detail and answers in your
terminal — your model, your session, fully inspectable. Then it calls
focus_nodes, and the graph you have open lights up the exact nodes the
answer is about — switching to the right run, or opening a browser tab, if
it has to — and hands back a deep link that restores the same highlight for
anyone you paste it to.
You don't have to invent the questions, either: the bottom of the inspector writes them for you, from the run you're looking at, with a copy button.
Nothing is pinned, prompted, or proxied: rungraph contributes the graph, not the conversation. The read-only tools work with no server running at all.
| tool | does |
|---|---|
list_runs | the run index |
get_graph | one run's graph, compact by default (signals + files + coverage included) |
find_nodes | narrow before you pull — a big graph is 20k+ tokens |
get_detail | the actual error text behind one node |
focus_nodes | light up the open dashboard; returns a pastable deep link |
get_current_view | what the dashboard is showing right now |
open_visualization | open the browser on a run |
With more than one dashboard live — yours, plus a bundle someone sent you
(below) — the MCP aggregates them: list_runs merges every server's runs,
tagged with where they came from, and every other tool routes by run id to the
dashboard actually showing that run.
Sharing a run
A run can leave the machine — as a file, on your terms. Say Bilal's agent went sideways and you could help, or you want to show a colleague where a feature was actually built.
Bilal exports. Either from the dashboard — share… in the runs pane, check off runs, review what's about to leave — or by asking his agent:
rungraph export --last 2 --as Bilal
# rungraph: export inventory (full content):
#   2 runs · 143 nodes · 12 of your prompts included
#   files touched: 24
# rungraph: wrote acme-2026-08-15.rungraph (412,882 bytes)
The inventory prints every time: people don't realize how much lives in a
transcript, so the tool shows it before it leaves. And export blocks if it
finds a high-confidence secret (AWS keys, GitHub/Slack/API tokens, private-key
blocks — anchored patterns, calibrated for near-zero false positives), listing
exactly where each one is. Resolve with --redact-secrets (placeholders,
everything else verbatim), --structure-only (graph shape, tool names, files
and timings — no prompts, no outputs), or --allow-secrets if they're fixture
keys you've checked.
The file is the transfer. Send the .rungraph over whatever you already
trust — Slack, AirDrop, a repo. rungraph itself never touches a network.
You open it.
npx rungraph open team-work.rungraph
That serves the bundle on its own ephemeral dashboard — nothing is copied anywhere; close the process and it's gone; keep the file to re-open it any time. Every run wears its provenance ("shared by Bilal · team-work.rungraph"), and the whole loop works on it: signals derive on your rungraph, and your own agent can be pointed at Bilal's runs — "what went wrong in the bundle Bilal sent me?" — right alongside your own.
A bundle carries the vendor-neutral IR, so a Codex or Hermes run exports and
opens identically to a Claude Code one, and opening a bundle needs no adapters
at all. sharedBy is a display string, not an identity — trust a bundle the way
you trust the channel it arrived on.
Link to what you see. copy link in the header captures the current view —
run, selected node, focus — as a URL; focus_nodes returns the same kind of
link, so your agent can hand you something pastable for a PR or an issue. Links
re-execute their query on load (a find link re-finds, a signal link
re-derives), and a link that lands on the wrong dashboard offers a one-click
jump to the one that has the run.
Getting around
Navigation is Figma-style, built for the tall, skinny graphs real runs produce:
| Input | Action |
|---|---|
| Two-finger scroll | Pan |
| Pinch / cmd+scroll | Zoom at the cursor |
| Click-drag | Pan |
| Click node / edge | Inspect it |
| Double-click node | Zoom to 100%, centered |
j / k (or ↓ / ↑) | Walk nodes in run order, inspector follows |
f | Fit the whole graph |
/ | Find by label or file |
Esc | Deselect and clear the focus |
A minimap (bottom-right) shows the whole run as a strip with a draggable viewport — errors glow as red beacons; click one to jump straight to the failure. Runs open at readable zoom: finished runs at the first prompt, live runs at the latest activity, with follow mode sliding the view as new nodes stream in.
The runs pane groups sessions by project; when runs from more than one
agent are on the machine, a chip rail above the list filters by agent
(all · claude · codex · hermes · opencode), and runs with no real project to stand in —
deleted worktrees, home-directory chats, Hermes tasks started from nowhere —
gather under a single ✦ loose runs group.
Resume from the dashboard. The graph is where you find a session — the
run where auth broke, the conversation from Tuesday you half-remember — and
every local session carries the edge back to the terminal: resume in the
run header, or hover a run in the list (workflow rows resume via their parent
session's row). Copy the exact claude --resume / codex resume /
hermes --resume / opencode --session command (shown in full, so it also
teaches the incantation),
or on macOS open a new Terminal window with the session already loading
(RUNGRAPH_TERMINAL=iTerm targets iTerm2 instead). A live Claude run
pre-checks fork — resume a copy rather than interleaving with the running
session — and forking an old run to branch it is first-class too. Bundle-served
runs are other machines' transcripts, so they offer no resume at all.
For agents
Everything the UI can do, a coding agent can do over the CLI — no browser, no
prompts, JSON on stdout, logs on stderr, exit codes 0 ok / 1 error / 2 no
runs found. Paste this section into a prompt and an agent can self-serve:
npx rungraph list --json
# {"runs":[{"runId":"claude-code:…:5822df8b-…","kind":"session","title":"Fix flaky auth test",
#           "project":"/home/you/dev/app","modifiedAt":"2026-08-11T16:31:06.055Z","active":true,…},…]}

npx rungraph graph 'claude-code:…:5822df8b-…' --json
# The full Graph IR for that run on stdout:
# {"irVersion":1,"meta":{"runId":"…","kind":"session","title":"…","totals":{"tokens":184230,"toolCalls":57,"agents":4},
#                        "coverage":{"records":1075,"unrecognized":0,"sourcesUnread":0},…},
#  "nodes":[{"id":"…","kind":"agent","label":"Investigate flaky test","status":"completed",
#            "files":["/home/you/dev/app/src/auth/token.js"],"tokens":{…}},…],
#  "edges":[{"kind":"spawn","from":"…","to":"…","label":"Investigate why auth.spec.ts flakes"},…],
#  "groups":[…],
#  "signals":[{"kind":"retry-storm","severity":"high","nodeIds":["…"],"label":"6 failed Edit calls",
#              "reason":"Edit failed 6× across 3 consecutive steps on token.js, …"}]}
# → an agent can read its own past runs: what it spawned, what failed, where the human said no.

npx rungraph find 'claude-code:…:5822df8b-…' token.js --json
# {"matched":4,"nodeIds":[…],"nodes":[…]}
# → narrow first. A big graph is 20k+ tokens of context to answer one question.

npx rungraph serve --no-open
# {"url":"http://127.0.0.1:4321"}   (server stays in foreground; same data over HTTP + SSE live tail)
The same surface is available as MCP tools — see "Ask your agent about a run"
above, or rungraph mcp --install.
The IR is versioned and documented in SCHEMA.md. It is
vendor-neutral, with four adapters: Claude Code (sessions, subagents, and
Workflow runs, under ~/.claude/projects), Codex CLI (rollout threads and
their spawned subagent threads, under ~/.codex/sessions), Hermes Agent
(sessions and their delegation lanes, from the SQLite database at
~/.hermes/state.db; RUNGRAPH_HERMES_HOME points the scan elsewhere), and
opencode (sessions and their subagent lanes, from the one global SQLite
database at ~/.local/share/opencode/opencode.db — XDG_DATA_HOME is
honoured, and RUNGRAPH_OPENCODE_HOME points the scan elsewhere).
Everything downstream — including .rungraph bundles — carries only the IR.
Privacy
Everything is local. The server binds 127.0.0.1 only, and every request is
Host-header-guarded, so a hostile web page can't DNS-rebind its way into your
transcripts. rungraph makes no network requests and phones nothing home.
Nothing leaves your machine unless you run rungraph export — an explicit
command naming explicit runs, which prints an inventory of what's included
every time and hard-stops on detected secrets. The transfer channel for the
resulting file is yours, not rungraph's.
The one other way out is rungraph mcp, where a tool result travels in an API
request to whichever model you are using — and lands in that session's own
transcript. So it carries the same guard: every MCP result is redacted on the
way out, node labels included and not just get_detail payloads, and the tool
reports how many values it replaced so a redacted run is never mistaken for a
clean one. The dashboard still shows the real values: those never leave
127.0.0.1, and reading a key is how you rotate it.
How it works
Claude Code writes JSONL transcripts under ~/.claude/projects — main session
files, per-subagent files, and workflow journals with a manifest per run.
Codex writes rollout JSONL under ~/.codex/sessions. Hermes Agent keeps
everything in one SQLite database (~/.hermes/state.db), and opencode keeps
every session on the machine in one more
(~/.local/share/opencode/opencode.db) — both read with Node's built-in
node:sqlite: readonly, live (WAL), zero dependencies added. opencode records
several things the other adapters have to infer — the exact parent/child
session id for every subagent, the agent that ran each session, and the
absolute file list behind every patch — so those are read rather than guessed. rungraph reconstructs the run graph from those sources post-hoc:
adapters turn transcript lines (or rows) into a versioned, vendor-neutral IR,
and everything downstream (web UI, CLI, HTTP API) consumes only the IR.
It is built to survive real transcripts:
- Never a blank screen. Unknown line types are skipped and counted — if the transcript format is newer than your rungraph, you get a banner and a graph, not a crash. A half-written final line (an agent mid-write) is tolerated and retried on the next tick.
- Live without hooks. Liveness comes from watching the run's own files; the graph updates over SSE with stable node ids, so deltas merge instead of redrawing.
- Light on your machine. The backend has zero runtime dependencies
(
node:http,fs.watchand friends). The frontend (Preact + elkjs) ships prebuilt in the package — there is no build step on your machine.
CLI reference
rungraph                       scan, serve, open browser (human default)
rungraph list [--json]         run index, newest first
rungraph graph <runId>         Graph IR for one run (JSON on stdout)
rungraph find <runId> <query>  nodes whose label or files match a substring
rungraph serve [--no-open]     start server; prints {"url": …}
rungraph export <runId…>       write a shareable .rungraph bundle (see --help)
rungraph open <bundle…>        serve bundle files, ephemerally
rungraph mcp [--install]       MCP server on stdio; --install registers it once
                               (--client opencode prints a block to paste instead)
rungraph mcp --check           verify the agent side end to end
  --project <path>             only runs for this project directory
  --port <n>                   preferred port (auto-increments if taken)
  --last <n>                   export: the n most recent runs of this project
  --client <c>                 mcp --install: claude (default) | opencode
  --scope <s>                  mcp --install --client claude: user (default) | project | local
Requires Node ≥ 20.
Roadmap
- Annotations — mark nodes before exporting a bundle ("look here first").
- Cross-run questions — file attribution lives in each run's IR, so asking "what else touched this file?" across runs needs iteration, not a migration.
- Run comparison — diff two runs of the same task.
- Cost estimates — turn per-node token counts into dollars.
Contributing
Adapters for other agent CLIs are the most valuable thing you can add, and
bug reports with a --structure-only bundle attached are the most useful
kind. CONTRIBUTING.md has the repo map, the project's
non-negotiables (worth reading before you build), and the fixture
workflow. Security reports: SECURITY.md, privately please.
License
// faq
What is rungraph?
Ask your agent what happened in a run — it answers in your terminal and lights up the exact nodes on an open graph. Claude Code, Codex, Hermes.. It is open-source on GitHub.
Is rungraph free to use?
rungraph is open-source under the MIT license, so it is free to use.
What category does rungraph belong to?
rungraph is listed under mcp-servers in the Claudeers registry of Claude-compatible tools.
// embed badge

[](https://claudeers.com/rungraph)
// retro hit counter

[](https://claudeers.com/rungraph)
// reviews
// guestbook
// related in MCP Servers
 🔓
🔓f.k.a. Awesome ChatGPT Prompts. Share, discover, and collect prompts from the community. Free and open source — self-host for your organization with complete…
 🔓
🔓A cross-platform desktop All-in-One assistant for Claude Code, Codex, OpenCode, OpenClaw, Gemini CLI & Hermes Agent. Only official website: ccswitch.io
 🔓
🔓🪨 why use many token when few token do trick — Claude Code skill that cuts 65% of tokens by talking like caveman
 🔓
🔓An open-source AI agent that brings the power of Gemini directly into your terminal.