
Icarus-Figures
Publication-grade figures for scientific papers — reproducible matplotlib & TikZ, with a quality bar, composition paradigms, and journal-grade craft. A self-…
Install with your AI
Paste into Claude Code, Cursor, or any agent — it reads the repo and wires the tool into your project.
Install and set up Icarus-Figures (git-clone project) into my current project.
Found on https://claudeers.com/icarus-figures
Repo: https://github.com/TAO-QKV/Icarus-Figures
Homepage/docs: —
Detected install method: git-clone → git clone https://github.com/TAO-QKV/Icarus-Figures
Category: skills. Platforms: api.
Read the repo's README for exact setup and env vars, then install it and wire it into my project.

Claudeers Health Verdict:
slowing; community-verified: false. Confirm the source before running anything.
git clone https://github.com/TAO-QKV/Icarus-Figures
// compatibility
| Platforms | api |
|---|---|
| Operating systems | — |
| AI compatibility | claude |
| License | MIT |
| Pricing | open-source |
| Language | Python |
Icarus Figures — publication-grade scientific figures for papers
Turn "a dataset + a claim" into a publication-grade figure — the kind a top-journal editor accepts with no revision request. Icarus Figures is a self-contained Claude/Codex skill: reproducible matplotlib/seaborn plots for data figures, and original TikZ for hero/method figures.
Example output
The point is not "many chart thumbnails"; it is complex paper figures with hierarchy, insets, cross-panel evidence, and honest uncertainty.
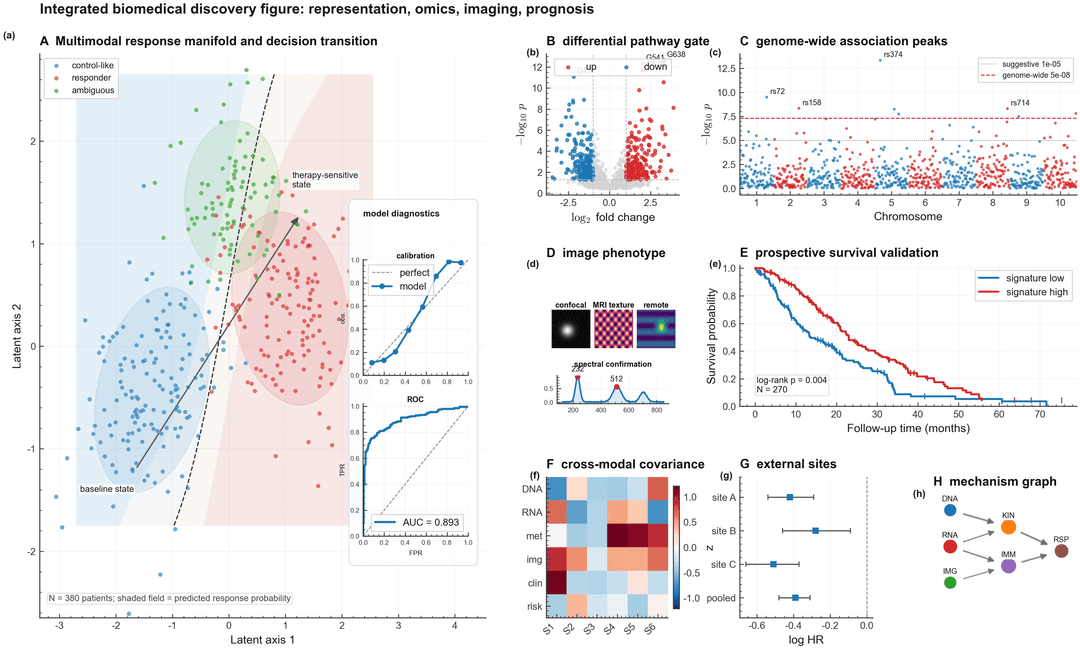
Complex biomedical evidence panel - a single integrated figure with a hero response manifold, decision field, calibration/ROC diagnostics, volcano + Manhattan omics evidence, imaging plate, survival validation, forest plot, covariance heatmap, and mechanism graph (examples/complex_panels.py):
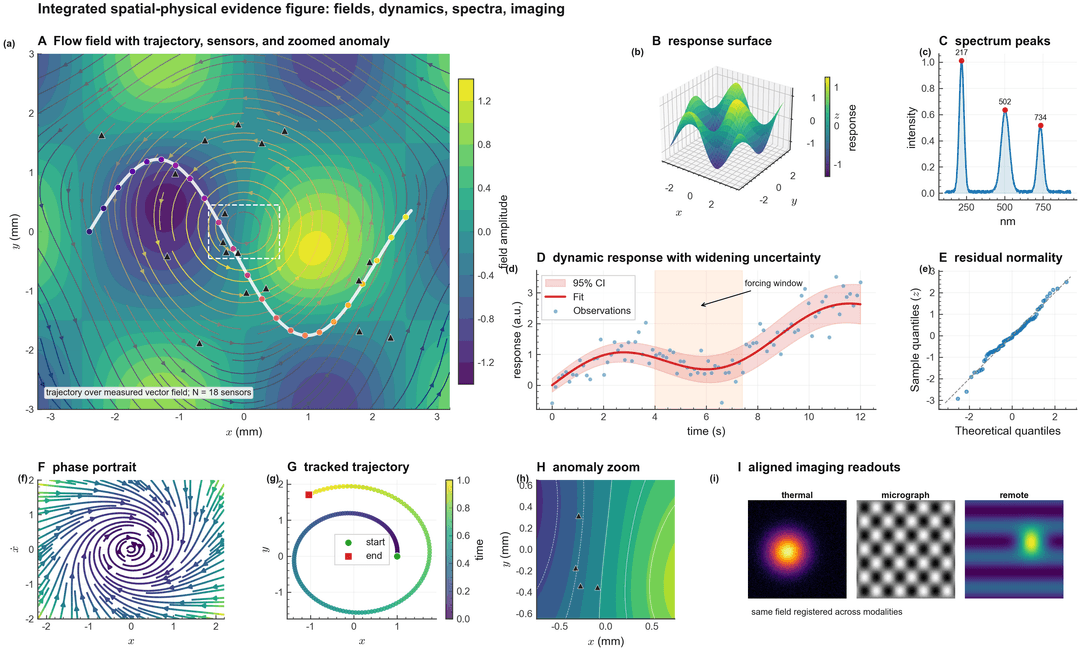
Complex spatial-physical evidence panel - field + streamline + trajectory + sensors as the hero panel, with response surface, spectrum, time-series uncertainty, QQ residual check, phase portrait, anomaly zoom, and registered imaging readouts:
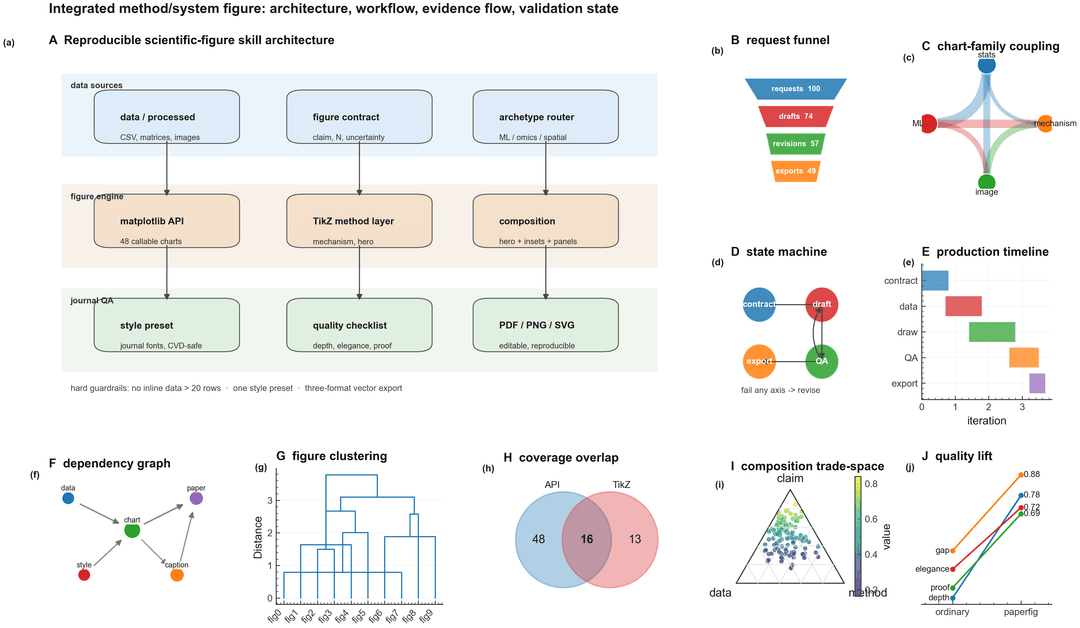
Complex method/system figure - architecture, workflow, evidence flow, state machine, production timeline, dependency graph, clustering, set overlap, ternary trade-space, and quality-lift slopegraph:
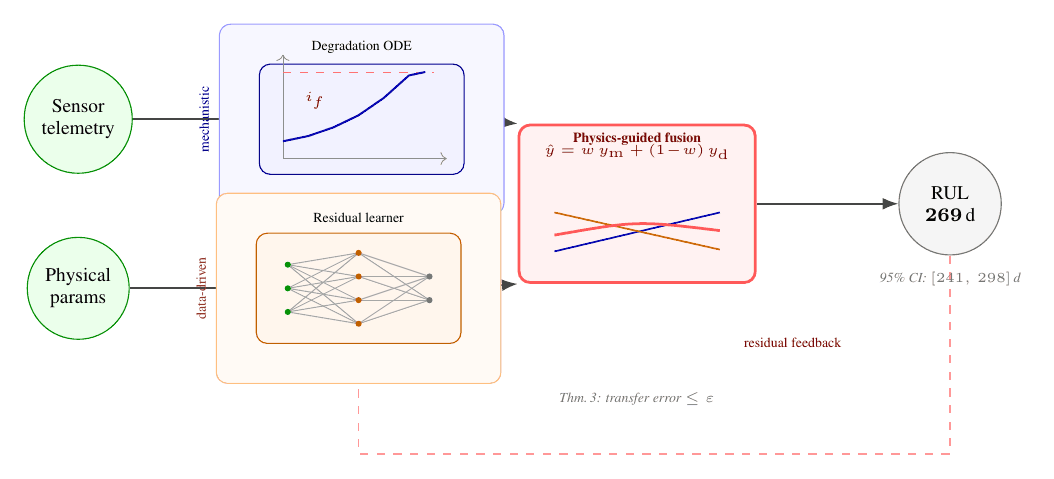
Framework / method hero figure (original, compilable TikZ) - the figure a paper opens with: a two-paradigm framework (mechanistic + data-driven, fused at the contribution), with a real method object embedded in each lane (a degradation curve crossing its failure threshold, an actual MLP, the fusion's prediction lines) instead of text-in-boxes. One pdflatex away, zero compile risk to the main document (examples/hero_tikz/framework_hero.tex; see framework-figures.md):
Additional composite galleries are reproducible coverage examples, not the visual front door: showcase_gallery.py, coverage_gallery.py, domain_showcases.py.
Lower-level API smoke/demo galleries are kept as regression checks rather than the visual front door: gallery.py, archetypes_gallery.py, paradigms_gallery.py, modern_gallery.py, scientific_gallery.py, advanced_gallery.py, rich_gallery.py, before_after.py.
Quickstart (with Claude)
- Put your data in
data/processed/your_data.csv. - Open Claude in this folder and say:
Plot a figure from
data/processed/your_data.csv; the claim is "Y declines linearly with X". - The
icarus-figuresskill triggers and produces:- a reproducible script
scripts/figN_<name>.py - the figure in three formats
outputs/figures/figN_<name>.{pdf,png,svg} - a caption that states the conclusion
- a row in
outputs/figures/figure_manifest.csv
- a reproducible script
Use it as a library (no Claude needed)
pip install -e . # or: pip install -e ".[extras]" for pandas/seaborn/scipy
import numpy as np
from paperfig import paper_style, save, timeseries_ci, scatter_fit, heatmap

paper_style(font='sans', journal='ieee')   # font: 'sans'|'serif'|'cn'; journal: None|'ieee'|'nature'|'pnas'

t = np.linspace(0, 10, 50); y = 1 - np.exp(-0.3 * t)
fig, ax = timeseries_ci(t, y + np.random.normal(0, .05, 50), y, y - .06, y + .06,
                        ylabel='Signal $y$')
ax.set_title('My result')                  # tweak the returned fig/ax freely
save(fig, 'fig1_main_result')              # → outputs/figures/fig1_main_result.{pdf,png,svg}
48 callable chart types, each returning (fig, ax) or (fig, axes):
| Domain | Functions |
|---|---|
| core | timeseries_ci, sorted_bar, grouped_bar, scatter_fit, heatmap, pareto, tornado |
| distributions | violin, raincloud, ridgeline, histogram, box, ecdf, qq, jointplot, hexbin_density |
| ML / diagnostics | roc_curve, pr_curve, calibration, confusion, residual_diag, feature_importance, convergence_curve, embedding_scatter, attention_map |
| stats / comparison | bar_err (+ significance brackets), bubble, forest, bland_altman, slopegraph, radar |
| omics / genomics / medical | volcano, manhattan, survival (Kaplan-Meier) |
| fields / dynamics / spectra | contour_field, streamplot_field, surface3d, phase_portrait, trajectory, spectrum, ternary |
| structure / set / flow | sankey, chord, dendrogram, network_graph, venn2 |
| imaging plates | image_panel (microscopy / medical / remote-sensing image panels with scalebars) |
| transfer / method | alignment_scatter (P5 motif) |
Best-fit route: quantitative and ML panels use the callable matplotlib API; mechanism / architecture / workflow figures use the TikZ composition paradigms; image-heavy evidence uses image_panel plus quantitative subpanels. Pie/donut charts are intentionally not highlighted because the cookbook treats them as low data-ink defaults; prefer sorted bars unless composition is the point.
-
Journal presets —
paper_style(journal=...)sets that publisher's single-column figure size + font sizes:journal 1-col width journal 1-col width journal 1-col width nature89 mm cell85 mm acs3.33 in science57 mm pnas87 mm rsc83 mm ieee3.5 in elsevier90 mm aps86 mm (From each publisher's public author guidelines — verify against the current guidelines, specs drift.)
-
LaTeX is optional — figures render without a LaTeX install; opt in with
paper_style(tex=True)for true LaTeX typography.
Or just a matplotlib style (no API)
import paperfig                 # registers the style name
import matplotlib.pyplot as plt
plt.style.use('paperfig')       # now any plt.* plot is publication-grade
The idea
Publication-grade = the cookbook's §0b four axes, all true at once: Depth (the figure argues a mechanism) × Elegance (one figure, one claim) × Unimpeachable (carries its own uncertainty + reproducible) × Visible gap (reads journal-grade at a glance). Archetypes A1–A13 are the floor, not the ceiling.
Relation to SciencePlots
SciencePlots is the excellent, popular toolkit for matplotlib styles — and Icarus Figures borrows its best ideas through the compatible paperfig Python package: a plt.style.use('paperfig') .mplstyle, cascading journal presets, and citability. The differences:
- Icarus Figures does not require LaTeX (SciencePlots does); LaTeX is opt-in (
tex=True). - Icarus Figures adds what a style sheet can't: a quality bar (§0b four axes), hero/method-figure composition paradigms (§I P1–P6), callable archetype functions (
timeseries_ci,alignment_scatter, …), and original TikZ for method figures (§K).
Think of it as: SciencePlots-style presets, plus the judgment and building blocks to make the figure itself publication-grade. If you only want journal styles, SciencePlots is great; if you want the figure's content held to a bar, use Icarus Figures.
Layout
| Path | What |
|---|---|
paperfig/ | the installable package: style.py (preset) + archetypes.py (callable A1–A10 + P5) |
examples/ | runnable galleries (complex_panels.py, showcase_gallery.py, coverage_gallery.py, domain_showcases.py, scientific_gallery.py, advanced_gallery.py, archetypes_gallery.py, paradigms_gallery.py) + five complete compilable TikZ framework heroes (hero_tikz/: P1 pipeline, P2 swimlanes, + T4 graphical-model / data-tensor / matrix-fit families) |
tests/ | pytest smoke tests (every archetype + three-format save) |
.claude/skills/icarus-figures/SKILL.md | the Icarus Figures skill (triggers, hard rules) |
.../references/figure-cookbook.md | main reference: §0b quality bar · §0a contract · §0 style · §A archetypes A1–A13 · §I composition paradigms P1–P6 · §J craft spec · §K original TikZ · §L external template library · §M Origin front-end |
.../references/figure-critique.md | the quality gate: operationalizes the §0b four axes + worked before→after critiques |
.../references/framework-figures.md | framework/method-figure deep-dive: five compilable hero examples + borrowable TikZ techniques + curated resources |
.../references/caption-and-quality.md | caption writing + final quality checklist |
scripts/critique.py | runnable critique gate — static-analyses a figure script against the bar, exits non-zero on a hard-rule miss |
scripts/_style.py | back-compat shim → paperfig.style |
data/processed/ · outputs/figures/ | input data · output + figure_manifest.csv |
CLAUDE.md · pyproject.toml | project role + <TEMPLATE_LIB> convention · packaging |
Hard rules
Reproducible (a script reads data from a file; no inline data > 20 rows; no AI-generated images) · vector three-format (PDF + PNG + SVG; plus TIFF/EPS at journal submission via save(fig, name, formats=('pdf','tiff'), dpi=600)) · style preset called once · colorblind- and grayscale-safe · units / N / uncertainty on the figure · pass the §0b four axes + §F reproducibility checklist before "done".
These are enforced, not just exhorted: python scripts/critique.py scripts/figN_<name>.py static-analyses a figure script against the bar — hard-rule misses (no uncertainty, jet colormap, equal grid, default style, PNG-only) come back as FAIL (non-zero exit, so it gates CI), and the judgment-half (does the figure argue a mechanism? does one hero panel dominate? B&W-legible?) prints as prompts you answer by hand. See references/figure-critique.md.
Requirements
Python 3.9+, matplotlib, numpy, pandas; seaborn for heatmaps; a LaTeX install with TikZ for §K hero figures (optional). See requirements.txt.
License
MIT © 2026 TAO-QKV. Use it, fork it, adapt it for your papers.
// faq
What is Icarus-Figures?
Publication-grade figures for scientific papers — reproducible matplotlib & TikZ, with a quality bar, composition paradigms, and journal-grade craft. A self-contained Claude skill.. It is open-source on GitHub.
Is Icarus-Figures free to use?
Icarus-Figures is open-source under the MIT license, so it is free to use.
What category does Icarus-Figures belong to?
Icarus-Figures is listed under skills in the Claudeers registry of Claude-compatible tools.
// embed badge

[](https://claudeers.com/icarus-figures)
// retro hit counter

[](https://claudeers.com/icarus-figures)
// reviews
// guestbook
// related in Claude Skills
 🔓
🔓An agentic skills framework & software development methodology that works.
 🔓
🔓 🔓
🔓💫 Toolkit to help you get started with Spec-Driven Development
 🔓
🔓AI coding assistant skill (Claude Code, Codex, OpenCode, Cursor, Gemini CLI, and more). Turn any folder of code, SQL schemas, R scripts, shell scripts, docs,…