
CC-Monitor
Claude Code Monitor : Monitor & audit every action Claude Code takes on your computer.
Install with your AI
Paste into Claude Code, Cursor, or any agent — it reads the repo and wires the tool into your project.
Install and set up CC-Monitor (git-clone project) into my current project.
Found on https://claudeers.com/cc-monitor
Repo: https://github.com/cn0xroot/CC-Monitor
Homepage/docs: —
Detected install method: git-clone → git clone https://github.com/cn0xroot/CC-Monitor
Category: plugins. Platforms: cli, api, desktop, web, mobile.
Read the repo's README for exact setup and env vars, then install it and wire it into my project.

Claudeers Health Verdict:
active; community-verified: false. Confirm the source before running anything.
git clone https://github.com/cn0xroot/CC-Monitor
// compatibility
| Platforms | cli, api, desktop, web, mobile |
|---|---|
| Operating systems | — |
| AI compatibility | claude |
| License | MIT |
| Pricing | open-source |
| Language | JavaScript |
CC-Monitor
English | 简体中文
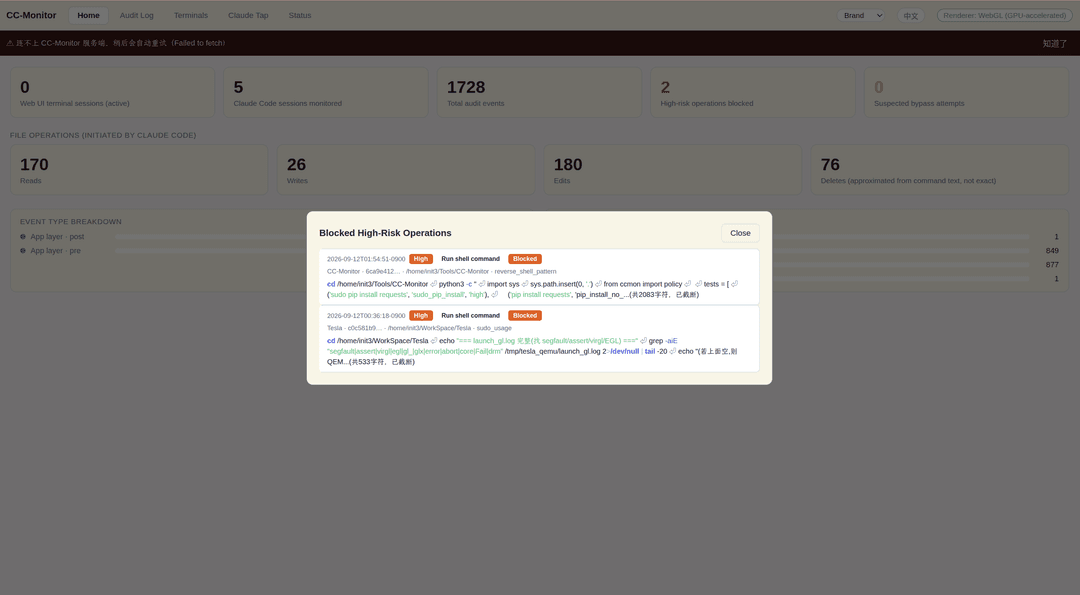
Ever let an AI agent write code for you and had no idea what it actually did to your machine along the way? Give this a try. It monitors what Claude Code does on your machine — file reads/writes, shell command execution, network access — and blocks or asks for confirmation on high-risk operations, so an AI coding agent can't quietly damage your system or leak data. Everything is audit-logged. The technical design doc is available in English and Chinese. For what risks installing this actually carries, what third-party modules it depends on, and where your data actually goes, see SECURITY.md (Chinese).
Screenshots
| Home overview |
|---|
 |
| Session list drilldown | Event type breakdown |
|---|---|
 |  |
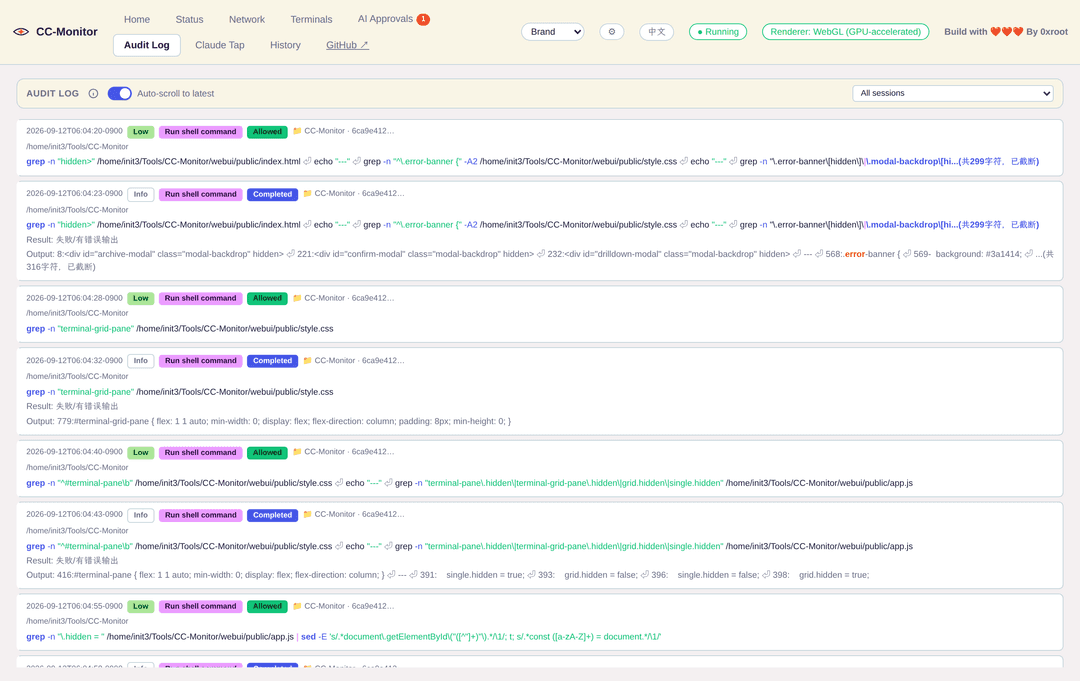
| Blocked high-risk operations | Audit log |
|---|---|
 |  |
Quick Install
git clone https://github.com/cn0xroot/CC-Monitor.git
cd CC-Monitor
./install.sh
install.sh runs 5 steps in order: the ccstatusline terminal statusline, hook
registration, Web UI dependencies, a system-layer probe check, and the GeoIP database —
each one idempotent and independently skippable (--skip-ccstatusline / --skip-geoip),
never overwriting anything you already have configured. Then run ./start.sh to launch
the Web UI.
If you only want the core interception/audit capability and don't need the Web UI or any of that, this one step is enough on its own:
python3 install.py
It does exactly one thing — registers the hooks into Claude Code's
~/.claude/settings.json. No npm or Python dependencies get installed (cc_monitor/
itself is standard-library-only Python). Once that's done, the CC-Monitor tail/rules/stats/verify CLI commands already work; the Web UI is an entirely
optional, separate add-on you can install later whenever you want it. For the exact
flags each script takes, what install.sh's 5 steps actually do, and installing to a
system path (make install), see the Installation section below.
Web UI
webui/ is a standalone Node.js service that provides a browser UI:
cd webui
npm install
node server.js          # listens on http://127.0.0.1:9999 by default, localhost-only
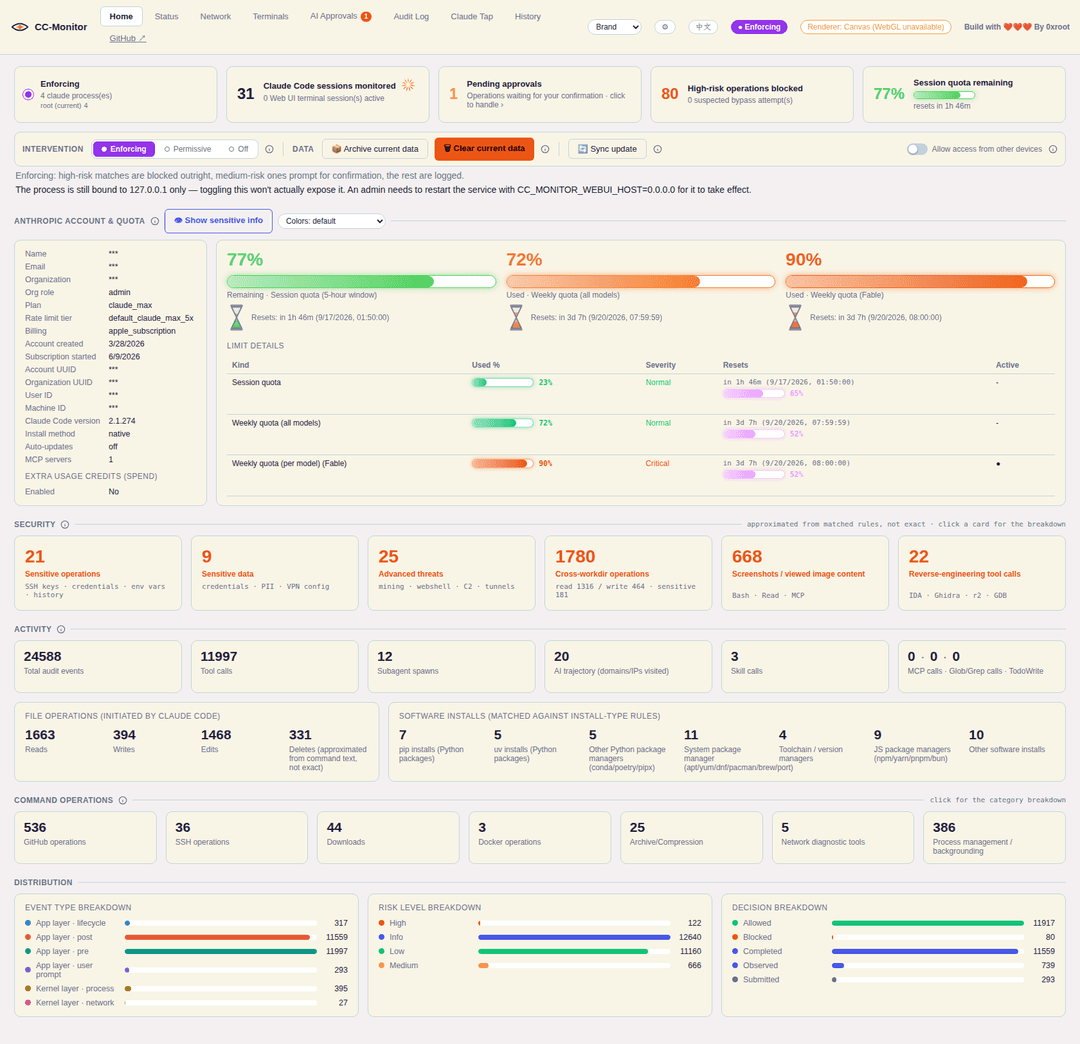
- Home:
- Audit control: a three-state toggle — running / paused / stopped (merged into one
button plus a separate stop button).
pausedstill evaluates rules and logs normally, but never actually blocks or asks for confirmation;stoppeddoesn't intervene at all — no evaluation, no logging. A persistent status pill sits in the top bar. - Claude Code identity check: detects which OS user every running
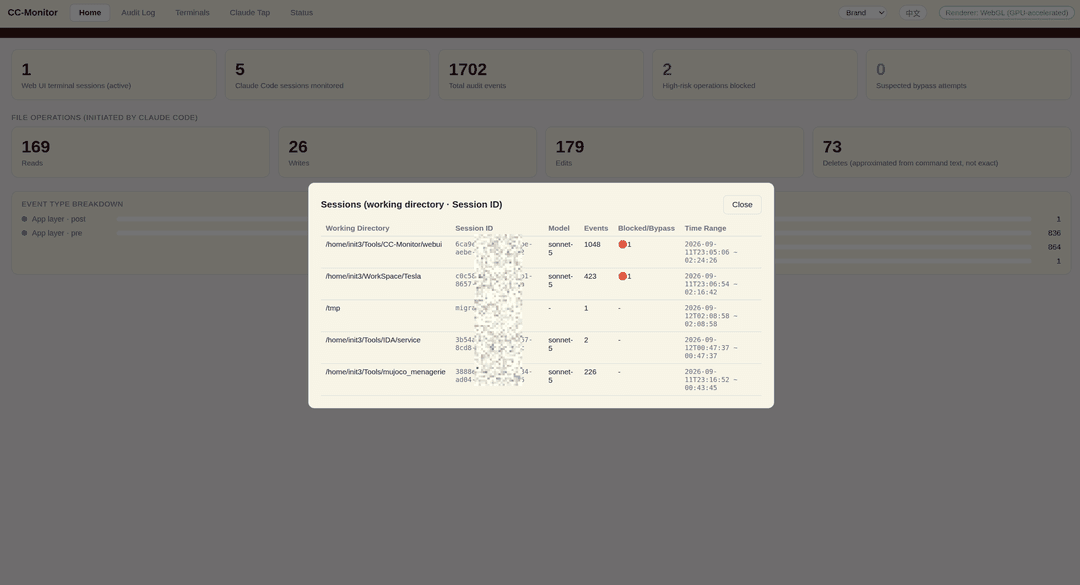
claudeprocess belongs to (cross-platform, implemented viaps), and flags it prominently when that differs from the Web UI's own user — the Web UI and the hooks each resolve~/.cc-monitor/from their own process's$HOME, so a mismatch means the two sides silently write to completely different databases; this card makes that otherwise- invisible situation visible. Click through for each process's PID/user/working directory. - Overview stats: live terminal session count, total Claude Code sessions detected,
total audit events (
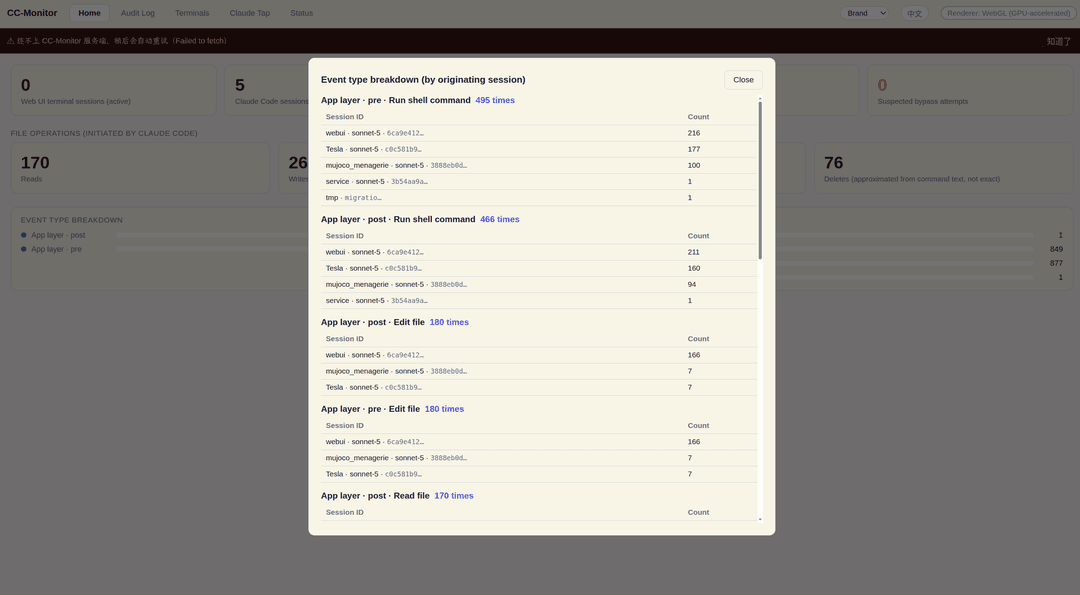
hook_pre+hook_post+ system-layer events combined), blocked/suspected-bypass counts, tool calls (countshook_preonly — a more direct "how many tool invocations actually happened" number than the raw event total), MCP calls (identified via themcp__<server>__<tool>naming convention, click through for a per-server breakdown), and AI trajectory (domains/IPs Claude Code has visited, backed by the same data as the Network tab — a blend of two kinds of evidence: real connections the system-layer probe (eBPF/nettop) actually observed, plus targets inferred from the text of wget/curl/git clone/ssh/scp/… commands Claude ran, tagged "inferred" so they're never mistaken for confirmed probe data. Many people never start the system-layer probe by hand, so this card used to sit empty even when Claude had clearly run a pile of networked commands — now both kinds of evidence show up here, and on the world map too). The "total sessions" / "total events" / "blocked operations" / "tool calls" / "MCP calls" / "AI trajectory" cards are all clickable for drilldown detail. - File operation stats: read/write/edit/delete counts, each clickable for detail.
- Install operation stats: grouped by which install-type rule matched — pip / system
package manager (apt/yum/dnf/pacman/brew/port) / npm installs / other. The npm card combines
two rules' totals: local (
npm install/npm iwithout-g, log-level, never intrusive) and global (with-g/--global, confirm-level). Both run the same lifecycle scripts (preinstall/postinstall) with the same privileges, and both are a real supply-chain attack surface, but a global install sticks around on$PATHacross every project, so only the global case asks for confirmation. Clicking the card splits the drilldown into separate "Global installs"/"Local installs" groups instead of flattening them together. - Command-based operation stats (GitHub/SSH/Download/Docker/Archive/Network
Diagnostics/Process Management — seven groups): each group's home page footprint is a single
summary card (the number is the sum across that group's categories); clicking it expands into
a category breakdown table plus the full command list with syntax highlighting — avoiding a
home page wall-papered with 33 sub-category cards across the seven groups (that's what it used
to be, one full row per group). The drilldown interaction matches the existing MCP/Skill/
Subagent call cards:
- GitHub operations: git push / git clone / git commit / git pull-fetch / gh CLI
(PR/Issue/API…) / other git operations, classified from the Bash command text itself (most
git/gh commands don't violate any policy rule, so they never get a
matched_ruleand couldn't reuse the install-ops trick). - SSH operations: ssh (remote login/exec) / scp (file copy) / sftp (file transfer) / key
management (
ssh-keygen/ssh-copy-id/ssh-add/ssh-agent) / other (autossh/sshpass), classified the same way as GitHub operations (only the start of each sub-command, never a substring match against the whole text, so anecho'd string can't be misread as a real invocation). - Downloads: wget / curl (only counted when it writes to a file via
-o/-O/--output— a bare curl call to an API isn't a "download") / aria2 / other (axel/lftp/ftp/http). - Docker operations: run (start a container) / build (build an image) / exec (run inside a
running container) / compose (
docker composeor the standalonedocker-compose) / other (read-only inspection likeps/logs/images). run/build/exec are broken out separately since they can execute arbitrary code from an external image, Dockerfile, or a running container — a different risk tier than read-only inspection. - Archive/compression operations: tar / zip (incl. unzip) / 7z / gzip (incl. gunzip/zcat) / other (bzip2/xz/zstd/rar, etc.).
- Network diagnostic tools: nc (incl. the ncat/netcat aliases) / nmap / telnet / other
(socat) — purely a "was this tool used" visibility stat; an ordinary port probe like
nc -zv example.com 443is still counted here without implying danger — an actual reverse shell is blocked separately by the policy rule below. - Process management / backgrounding: nohup / disown / background job (a bare trailing
&) / other (setsid). "Background job" detection is deliberately narrow (requires the¬ be part of&&/2>&1/&>syntax, and be immediately followed by the end of the command or a;), to avoid false-positiving on the&inside a URL query string likecurl 'http://x.com/a&b=c'.
- GitHub operations: git push / git clone / git commit / git pull-fetch / gh CLI
(PR/Issue/API…) / other git operations, classified from the Bash command text itself (most
git/gh commands don't violate any policy rule, so they never get a
- Subagent spawn stats: same approach as the MCP/Skill call stats, grouped by
subagent_type(e.g.general-purpose/Explore/Plan/fork) — subagents consume independent resources and have their own full trail of operations, so they shouldn't be buried inside the generic "tool calls" count. - Screenshot audit: Claude Code has no built-in "screenshot" tool, so this is identified
from three independent signals — a Bash command invoking a screenshot CLI (
scrot,gnome-screenshot,import,spectacle,flameshot,maim,grim,xwd, macOS'sscreencapture, or the Wayland-typicalgdbus/dbus-sendcall toorg.freedesktop.portal.Screenshot); theReadtool opening a file that's itself an image (.png/.jpg/.gif/.webp/.bmp— deliberately broader than "screenshot," since viewing an existing image counts too); or an MCP/"computer use" tool's screenshot action (a tool name containing "screenshot," or acomputertool whoseactionfield is"screenshot"). Click through for the exact session, timestamp, and the command run or file opened — only that basic info is shown, the screenshot's own image content is never read or rendered, to avoid exposing potentially sensitive desktop content through the web page. - Anthropic account info: name, email, organization, org role, plan type, rate-limit
tier, billing type, and account/subscription creation dates, read straight from Claude
Code's own local global config file (
~/.claude.json'soauthAccountfield) — no network call, same source ccstatusline's "Claude Account Email" widget uses. Plus account-level usage/quota (same data source as the Status tab — the session quota shows "remaining %" with a conky-style stepped palette, weekly quotas show "used %" with a continuous red→yellow→green gradient, and per-model quotas like Fable are detected dynamically rather than hardcoded), thelimits[]breakdown (a progress bar, plus a purple "how far through this window" bar next to the reset time) andspend(whether pay-as-you-go usage credits are enabled, and how much has been used). - Data management: archive the current event data (a full SQLite
backup()snapshot) or clear it to start counting from zero; breakdowns by log type and risk level.
- Audit control: a three-state toggle — running / paused / stopped (merged into one
button plus a separate stop button).
- Log Audit: a full-width, live-updating audit log view (filterable by session — the session dropdown shows "folder · model · short ID" instead of an opaque ID string), reusing the same human-readable event-translation logic as the CLI.
- Terminal Sessions: open a Claude Code terminal directly in the browser (a PTY spawned via
node-pty) instead of switching to a local terminal app; rendered withxterm.js+ the WebGL addon, GPU-accelerated when available and falling back to Canvas otherwise. The sidebar can switch to a grid view (herdr-style) showing every live session on one screen at once; clicking a pane routes keyboard input to it. - Claude Tap: view the full conversation content sent to/received from the model for a given session (not just "which tool was called") — text, thinking, tool calls, tool results, token usage, each field color-coded. The data source is Claude Code's own local transcript JSONL file (the
transcript_pathfield in the hook payload) — not packet capture or MITM. CLI equivalent:CC-Monitor tap [--session ID] [-f]. - AI Approvals: mirrors Claude Code's "allow this action?" confirmation into the Web UI
— similar in spirit to Vibe Island popping an Allow/Deny card in
the Mac notch, except cross-platform (a web page instead of a Mac-only UI). Two kinds of
prompts land here:
- operations our own rule table flags as
confirm(decided by our rules atPreToolUse); - Claude Code's own native "Do you want to proceed?" dialog (the
PermissionRequesthook event — calls that matched no rule but that Claude Code's permission system wants a human to approve). An answer from the web page or the terminal is returned viadecision.behavior; if nobody answers (90s timeout) or you press Enter at the terminal, the request is handed back untouched to the native dialog — installing CC-Monitor never removes that safety net. - The same request can be answered either at the terminal that triggered it (y/N) or from
this page — whichever answers first wins. Choosing "allow" on the web page makes Claude
Code skip its own native popup entirely, via the hook's
permissionDecision: allowoutput, instead of asking twice. - Options: allow once, deny once, allow and don't ask again for 10/30 minutes, or always allow (scoped to this session only).
- Desktop app (Electron) does not use the browser path (in an Electron renderer
Notification.permissionis always "granted", yet macOS silently refuses notifications from an app that isn't properly signed): the main process polls the pending list itself and on a new request plays the system alert sound + bounces the Dock icon + sets a badge count, plus a system notification when the OS allows one (click → approvals tab).npm run electronruns the ad-hoc-signed Electron.app from node_modules, so on macOS the system notification always fails (UNErrorDomain error 1) — you get sound/Dock/badge only; a Developer-ID-signed build is needed for real notifications. The hook side additionally sends oneosascriptnotification per request (attributed to "Script Editor"); macOS asks once whether to allow it — if declined, re-enable it under System Settings → Notifications → Script Editor. - Supports browser desktop notifications (the Notification API) — new requests raise a system notification even when this tab isn't open, click it to jump straight back in.
- History table: every resolved request stays on record (the underlying table is never
purged by "clear current data"), with time, session, tool, matched rule, matched value,
outcome, and resolved-via. For
notify-kind records (AskUserQuestionand friends), it also captures the user's actual answer from the terminal.
- operations our own rule table flags as
- Status:
- The same Anthropic account info (name/email/organization/plan) as the Home page, plus
account-level usage (the 5-hour session window / weekly quota / per-model weekly quota +
reset times, queried from the same
api.anthropic.com/api/oauth/usageendpoint and OAuth credentials as ccstatusline). - Model Usage table: token usage summed by model (Sonnet/Opus/…) across every monitored session.
- Per-session model, token usage, throughput (tok/s, estimated from the transcript), and a
ccstatusline-compatibleΣ Total / Cachedtoken summary (same accounting: total = input+output+cached, cached = cache-read+cache-creation). - Context window usage %: estimated against a standard 200K context window (Claude Code doesn't report the exact window size to our hooks, so this is an approximation).
- Context compaction count: a real detection of
compact_boundaryevents in the transcript, not an estimate. - cwd, git branch, uptime, and blocked-operation counts.
- The same Anthropic account info (name/email/organization/plan) as the Home page, plus
account-level usage (the 5-hour session window / weekly quota / per-model weekly quota +
reset times, queried from the same
- Network: the actual network connections the Claude Code process tree has made —
destination IP/port, hostname, upload/download byte counts, connection count, plus a world
map plotting roughly where those destinations are. All of this comes from the system-layer
probe (
cc_monitor/probe_linux.bt, Linux + eBPF) — not packet capture or MITM.- Domain capture: a
uprobe:libc:getaddrinforecords the hostname the moment the application resolves it, instead of reverse-DNS-ing the IP afterward — many cloud/CDN egress IPs never had a PTR record configured, so reverse DNS can't recover a domain that was never registered in reverse; this method isn't affected. - Byte counts:
tcp_sendmsg/tcp_cleanup_rbufkernel probes, since the probe previously only knew "connected to this IP:port," not how much data moved. - IP geolocation: a local database (no per-IP third-party API calls) — either MaxMind GeoLite2 or the no-signup-needed DB-IP Lite both work, see Requirements below; without one, the map and location column are simply empty and the page honestly says "no GeoIP database configured" instead of faking data.
- World map: drawn entirely in WebGL2 (equirectangular projection + a bundled low-res
coastline outline), following the approach from
BeeEye's
WorldMap.jsx— no map-tile service dependency. - Connection detail: "Connections" is clickable both per target row and on the two summary cards ("Total connections" / "Distinct IPs") — opens every connection's time, originating process, and PID.
- With the probe not installed or not running, this page just shows empty data.
- Domain capture: a
- Appearance settings: a ⚙ button in the top bar opens a settings dialog.
- Color theme: a visual swatch grid — each of the 10 themes (Brand/Dark/Light/Dracula/ Nord/Midnight/Ocean/Forest/Sunset/Rose, the last five ported from AI_Web_Search's color scheme) shown as its own accent-color dot with an active highlight; the original top-bar theme dropdown still works too and stays in sync.
- Interface font (system default / monospace / serif / rounded / Kaiti / Heiti
(Source Han Sans) / Songti (Source Han Serif)) and interface font size (12–18px
slider, applied at the root element with every
font-sizein the stylesheet inrem, so one change scales the whole app proportionally) — new settings, with a live preview, persisted tolocalStorage. The Chinese font options aren't bundled as font files (a full CJK glyph set is 17–21MB each, which would make the first font switch painfully slow) — they're plain font-name references that only render correctly where the visitor's system already has a matching font installed. - Language toggle: translation covers UI chrome (nav, buttons, titles, empty-state hints, risk/operation/status labels) but not the data itself (raw command text, tool output, transcript content). The risk/operation-type/status badges in the audit log use fixed, highly saturated colors that don't change with the theme; high-risk rows are shown in bold red.
Static assets are served with Cache-Control: no-store since this UI is still iterating fast — refresh the page after a code change and you'll see the latest version, no stale browser cache to worry about.
Binds to 127.0.0.1 only by default: this tool can spawn terminal processes directly and has
no authentication. The Home tab has an "Allow access from other devices" switch, but it only
sets a flag — the actual security boundary is the address the process was bound to at startup,
which a web page can't change at runtime. To really listen on all interfaces, an admin has to
explicitly set CC_MONITOR_WEBUI_HOST=0.0.0.0 and restart the service; only then does the
switch actually do anything (it defaults to off even when bound to 0.0.0.0, rejecting every
non-local request until turned on).
Desktop app (Electron)
If you'd rather not open a browser and run node server.js by hand, webui/ also has an
Electron wrapper — it directly requires the existing server.js (Express + ws + node-pty +
better-sqlite3) with zero server-side code changes, and runs as a standalone windowed app.
cd webui
npm install
npm run electron          # dev mode: runs directly, no packaging needed
Binds to 127.0.0.1:9998 (distinct from the web version's default 9999, so both can run at
the same time).
To build a distributable installer:
npm run dist:linux   # AppImage (x64 + arm64)
npm run dist:mac     # universal dmg (Intel + Apple Silicon)
Both scripts run electron-rebuild first to recompile node-pty/better-sqlite3 against
Electron's bundled Node ABI — these packages ship prebuilt binaries that don't match
Electron's Node version out of the box, so this rebuild step is required, not an optional
optimization.
Known status: the Electron version pinned in devDependencies (^44.0.0) isn't
arbitrary — an earlier build on the default 33.x reproducibly segfaulted on startup on a
recent AMD CPU (Zen 5), and switching to 44.x fixed it; this looks like a Chromium/CPU
compatibility bug in that older Electron release, so don't roll the version back. So far only
the "packaged app starts and its embedded server listens correctly" path has been verified
end-to-end on Linux x64; the macOS and Linux ARM64 builds haven't been validated end-to-end
yet.
Overview
CC-Monitor has a two-layer architecture:
- Application layer (Claude Code Hooks): registers
PreToolUse/PostToolUsehooks to get semantic info on every tool call (tool name, command, file path), then allows/blocks/asks based on configurable rules. This is the primary layer — cheap and broad coverage. - System layer (eBPF on Linux, nettop on macOS):
CC-Monitor-probeusesbpftraceto independently trace, at the kernel level, everyexecve/connectmade by the entire process subtree spawned by theclaudeprocess — completely independent of Claude Code's own cooperation. This is the second line of defense: it can still catch anomalies even if the hooks config itself gets tampered with or bypassed.- macOS: the same
CC-Monitor-probecommand switches tocc_monitor/probe_darwin.py, which samples the claude process tree's connections and byte counts every 2s with the built-innettop— no root needed. Network only (traffic page / world map / AI trajectory): there is noexecveobservation (the bypass detection behindCC-Monitor verifystays Linux-only) and hostnames fall back to reverse DNS.
- macOS: the same
Capabilities:
| Capability | Description |
|---|---|
| Block high-risk operations | Operations matching a rule (Bash/Write/Edit/...) can be denied outright (e.g. rm -rf /, writing to ~/.ssh/) |
| Interactive confirmation | Medium-risk operations prompt for confirmation in the terminal + a desktop notification; times out to "deny" if there's no tty |
| Audit log | Every event is persisted to SQLite, with the full tool_input/tool_response payload |
| Human-readable live log | CC-Monitor tail turns raw JSON into "event type + summary + result", auto-colored in a real terminal, with Bash commands syntax-highlighted (command name / flags / strings / variables / pipes) |
| Bypass detection | CC-Monitor verify cross-checks what the system probe observed against what the hooks recorded, and flags commands the probe saw but the hooks never logged |
| Network visibility | eBPF captures the destination IP:port of every connect() call directly — no TLS termination, no CA certificate to install |
How It Works
The Overview above is what it does; this is how, and every mechanism maps directly onto the source (full depth in DESIGN.en.md):
- Hook interception: before and after every tool call, Claude Code writes a JSON payload to the
configured hook command's stdin and waits synchronously for it to exit.
CC-Monitor-hookexiting with code 2 means "deny" — whatever it printed to stderr gets surfaced back to Claude Code. It's a one-shot subprocess spawned per call, not a long-running daemon, so there's no "the monitor process died and now nothing is enforced" failure mode (and also no need to restart anything after editing rules — the next call picks them up immediately). - Rule engine:
default_rules.jsonis an ordered rule list;policy.evaluate()walks it in order and the first match wins, so more specific rules need to come before more general catch-alls. Each rule declarestools(which tools it applies to),field(which key to read out oftool_input— e.g.command/file_path/url), a regexpattern, and arisk/action. The rule file is copied fromdefault_rules.jsoninto~/.cc-monitor/rules.jsonon first use, and can be edited from there. - System-layer eBPF probe:
probe_linux.btattaches to kernel tracepoints likeexecve/connect. It first recognizes Claude Code's own process viacomm=="claude", then listens forsched_process_forkevents to propagate a "being monitored" flag down through every descendant process it spawns — tracking continues even if a child process renames itself.CC-Monitor verifymatches commands the probe observed against what the hooks logged in the same time window (with quote-normalization to handle how zsh's snapshot wrapper escapes quotes), and flags anything the probe saw that the hooks never recorded. - Claude Tap: the hook's JSON payload includes a
transcript_pathfield pointing at Claude Code's own local conversation transcript JSONL file. Reading that file and parsing itsuser/assistant/tool_use/tool_resultentries reconstructs the full conversation — no packet capture, no CA certificate, no MITM proxy involved. - Account usage display: reads the OAuth token Claude Code itself stores (Linux:
~/.claude/.credentials.json; macOS: no file — it lives in the login Keychain as the generic-password itemClaude Code-credentials, read viasecurity find-generic-password), then calls Anthropic's ownapi.anthropic.com/api/oauth/usageendpoint with that token (adding theanthropic-beta: oauth-2025-04-20header) — the exact same credential and endpoint ccstatusline uses, not a separately maintained usage tracker. - Web terminal:
node-ptyspawns a real pseudo-terminal (PTY) — no different from opening a terminal window locally — then typesclaude\rinto it automatically to launch Claude Code. The first time Claude Code opens a directory it hasn't seen before, it shows a "do you trust this folder?" prompt defaulting to "No, exit"; this is detected by watching for that exact banner text and answered automatically (down-arrow + enter, selecting "Yes, I trust this folder") — otherwise the very next stray Enter keypress would silently exit Claude Code back to a bare shell while the terminal still looked perfectly functional.- New Window: shares the same working-directory picker modal as "New Session," the only
difference being it never types
claude\r— for when you just want a terminal (running a script, poking around files) without being dropped straight into a Claude Code session. Backend-wise it's justPOST /api/sessionswithlaunchClaude: false.
- New Window: shares the same working-directory picker modal as "New Session," the only
difference being it never types
- Data persistence/archiving: "Archive current data" on the Home tab uses SQLite's own
backup()API to take a full snapshot of the currentevents.db(not a plain file copy —backup()correctly handles data that hasn't been checkpointed out of the WAL journal yet), saved under~/.cc-monitor/archives/; "Clear current data" runsDELETEagainst the same database and resets the autoincrement counter.
Installation
Requirements
-
Hooks (
cc_monitor/): Python 3.8+, standard library only, no third-party packages. The system-layer probe additionally needsbpftraceon Linux (optional — the hooks work fine without it). -
Web UI (
webui/): Node.js ≥ 22 — not an arbitrary floor, it's whatbetter-sqlite3itself declares in itspackage.jsonenginesfield (expressonly needs Node ≥ 18, butbetter-sqlite3requires 22; an older Node will likely fail during install or at startup). Checknode --versionbefore installing, e.g. via nvm. -
Terminal statusline ccstatusline (optional): reads the same OAuth credential and calls the same Anthropic endpoint as CC-Monitor's own usage display (see "Account usage display" above), but it's an independently maintained third-party npm package — CC-Monitor never calls into it or bundles its code. Step 1 of
install.shchecks whether it's already installed (command -v ccstatusline) and runsnpm install -g ccstatuslineif not; once installed, if~/.claude/settings.jsonhas nostatusLineentry yet, it wires one in automatically (never overwriting any existingstatusLineconfig, whether it's ccstatusline or something else).--skip-ccstatuslineorCC_MONITOR_SKIP_CCSTATUSLINE=1skips both the install and the wiring. -
GeoIP location on the Network tab (optional): uses the
maxmindnpm package to read a local database file, which isn't shipped in this repo. Without one, the Network tab still works — the location column and map just have no data, and the page says so honestly rather than affecting the connection/byte-count stats. Two ways to get a database:- No account needed (recommended — this is what
./install.shdoes by default): sapics/ip-location-db republishes DB-IP Lite data (CC BY 4.0, city-level accuracy) as ready-to-use.mmdbfiles, updated automatically. Step 5 ofinstall.shdownloads it to~/.cc-monitor/dbip-city.mmdb(skipped if any.mmdbis already there; a failed download only warns; setCC_MONITOR_GEOIP_URLto use a mirror). Manual download works too:curl -L -o ~/.cc-monitor/dbip-city.mmdb \ https://github.com/sapics/ip-location-db/releases/download/latest/dbip-city-ipv4.mmdb - Official MaxMind GeoLite2: usually more accurate, but requires signing up for a free
account at MaxMind, generating a license
key, and manually downloading
GeoLite2-City.mmdbto~/.cc-monitor/GeoLite2-City.mmdb.
The two databases use different field layouts (MaxMind nests fields, DB-IP Lite is flat) —
geoip.jsrecognizes both, no extra configuration needed either way.CC_MONITOR_GEOIP_DBcan point at a different path than the defaults above. - No account needed (recommended — this is what
Verified working environment (not the only one that works — just the one this has actually been tested and confirmed on): Ubuntu 24.04 LTS (kernel 7.0, x86_64), AMD Ryzen 9 9950X (Zen 5), Node.js v22.17.1, npm 10.9.2, Python 3.13.5. The desktop (Electron) build was additionally verified to crash on startup on this CPU with the originally-pinned Electron 33.x, and to run correctly after upgrading to 44.x (see the Desktop app section below) — which is why that version isn't pinned back down.
In a hurry? ./install.sh runs these 5 steps in order:
- ccstatusline (optional terminal statusline): installs it globally via npm if missing,
then wires it into
~/.claude/settings.json'sstatusLinefield if that key isn't already set —--skip-ccstatusline/CC_MONITOR_SKIP_CCSTATUSLINE=1skips both - Registers hooks into Claude Code's
settings.json(python3 install.py, see the manual steps below for details) - Installs Web UI dependencies (
cd webui && npm install; skipped, Web UI only, if npm isn't found) - Checks whether the system-layer probe can run: on Linux, whether
bpftraceis installed; on macOS, nothing extra is needed (uses the built-innettop) — this step only detects and prints a hint, missingbpftracenever aborts the install - GeoIP database (optional, for the Network tab's location column): downloads DB-IP Lite
to
~/.cc-monitor/dbip-city.mmdbby default —--skip-geoip/CC_MONITOR_SKIP_GEOIP=1skips it
Then run ./start.sh to launch the Web UI (it installs dependencies on first run if needed).
For more control, the manual steps are below.
There are two ways to install it, with identical end results — pick whichever fits:
Option 1: run it in place (touches nothing outside this directory)
# 1. Put the whole CC-Monitor directory wherever you want it (assumed here: ~/Tools/CC-Monitor)
cd ~/Tools/CC-Monitor

# 2. Install the hooks into your Claude Code config (also chmod +x's everything under bin/)
python3 install.py                              # global install: writes ~/.claude/settings.json
python3 install.py --project /path/to/project    # project-scoped install
python3 install.py --target /path/to/settings.json  # explicit settings.json path (for cross-user installs)

# 3. (optional) install bpftrace if you want the system-layer probe
sudo apt install bpftrace        # Debian/Ubuntu
# see bpftrace's own docs for other distros; macOS needs nothing extra (the probe uses the built-in nettop)
The installer merges into the PreToolUse/PostToolUse/PermissionRequest hook arrays and de-duplicates by exact
command string, so it never overwrites any hooks you already have configured; a corrupted
settings.json gets backed up to .json.bak before being rebuilt. Restart Claude Code —
only new sessions pick up the updated config.
Option 2: make install onto the system path
If you'd rather have a global command and not have to remember where this checkout lives:
sudo make install                          # defaults to /usr/local/lib/cc-monitor + /usr/local/bin
sudo make install PREFIX=/opt/cc-monitor   # or pick your own prefix

# afterwards, the commands work from any directory; still do step 2 from Option 1 to
# register the hooks (using the path make install prints out):
CC-Monitor tail -v
python3 /usr/local/lib/cc-monitor/install.py
make install only copies the code onto the system and sets up the command-line symlinks — it
does not touch your ~/.claude/settings.json on its own; registering the hooks is a separate,
explicit install.py run (the exact path is printed at the end of make install). sudo make uninstall reverses it (again, code and symlinks only — any hooks already registered in
settings.json need to be removed by hand).
Build
CC-Monitor is pure Python (standard library only: sqlite3, json, argparse, re, ...) —
there is no build/compile step:
bin/CC-Monitor,bin/CC-Monitor-hook, andbin/CC-Monitor-probeare executable scripts with a#!/usr/bin/env python3shebang;install.pychmod's them automatically.- The system-layer probe depends on
bpftrace, which is a prebuilt binary from your system's package manager — nothing to compile.cc_monitor/probe_linux.btis a bpftrace script, interpreted at runtime bybpftraceitself. make installin theMakefileisn't a build step either — it just copies files underPREFIXand creates command-line symlinks; see "Installation" above.- It is not currently packaged as a single-file executable (e.g. via PyInstaller/Nuitka) — that's on the TODO list below.
Usage
# Live-tail monitored events (Ctrl+C to quit)
./bin/CC-Monitor tail
./bin/CC-Monitor tail -v          # also print the raw JSON

# Show the currently active rules
./bin/CC-Monitor rules

# Show stats (counts by risk level / decision)
./bin/CC-Monitor stats

# System-layer probe (needs root; cross-checks whether hooks are being bypassed)
sudo ./bin/CC-Monitor-probe

# Show records the probe flagged as "possibly bypassing the hooks"
./bin/CC-Monitor verify
Environment variables:
| Variable | Effect |
|---|---|
CC_MONITOR_HOME | Overrides the event DB / rules file directory (default ~/.cc-monitor/) |
CC_MONITOR_COLOR | always/never to force terminal color on/off (default: auto-detect a real tty) |
NO_COLOR | Forces color off when set (standard convention) |
Events and rules live under ~/.cc-monitor/: events.db (SQLite audit log) and rules.json
(editable rules — edits apply immediately, no restart needed).
Rule format (rules.json is an array of rules):
{
  "id": "rule_name",
  "risk": "high | medium | low",
  "action": "block | confirm | log",
  "tools": ["Bash"],
  "field": "command | file_path | url",
  "pattern": "regular expression"
}
block: deny outright; Claude Code receives the denial reason.confirm: prompts for confirmation in the terminal (waits foryon the tty) + a desktop notification; denies by default with no tty or on timeout.log: allow, but record it in the audit log.
Default rules live in cc_monitor/default_rules.json, covering: dangerous
deletes, disk-overwrite commands, curl|bash, recursive chmod 777, sudo, git push --force,
reading/writing SSH keys and credential files, writing to system directories, attempts to kill the
monitoring itself (kill/pkill targeting CC-Monitor's own probe process, confirm level; a
generic kill/pkill is log-only to avoid alert fatigue), reading SSH keys/.env/credential
files via cat/less/head and friends (a blind spot the Read-tool-only rule didn't cover),
dumping the whole environment via env/printenv/export -p, su/pkexec privilege escalation
(the same risk category as sudo), single-file non-recursive chmod 777 (relative paths included,
not just filesystem-rooted ones), and destructive direct database commands (mysql/psql/
redis-cli/mongo/sqlite3 followed by DROP/DELETE/TRUNCATE/FLUSHALL), reading shell
history files or running a bare history command (which can surface plaintext credentials typed
in the past), and reverse-shell/backdoor execution (covering -e/-c variants of
nc/ncat/netcat, socat exec:, and a mkfifo-plus-named-pipe reverse shell), tampering with
Claude Code's own config (~/.claude/settings.json/.claude/hooks//CLAUDE.md — the
config-layer counterpart to the anti-bypass rules above), Docker-socket-mount container escapes
(-v /var/run/docker.sock:...), common secret formats appearing in written content
(AWS/GitHub/Anthropic/OpenAI/Slack/Google/npm/Stripe fixed prefixes plus private-key headers),
and git-hooks/git-config persistence (core.hooksPath, url....insteadOf), and more.
Development Progress
For exactly what shipped in each version, see CHANGELOG.en.md (中文).
Implemented
- Application-layer hook interceptor (
PreToolUse/PostToolUse), covering Bash/Write/Edit/Read/WebFetch and other tools - Policy engine: regex rule matching + three actions (block/confirm/log) + three risk tiers
- SQLite audit log (
events.db), retaining the full hook input/output for every event - CLI:
CC-Monitor tail(live view) /rules(view rules) /stats(stats) /verify(bypass detection) - Human-readable event formatting: raw JSON turned into "event type + summary + result"
- Terminal color output: independent coloring for risk level / decision / rule name, with
NO_COLOR/CC_MONITOR_COLORsupport - Bash command syntax highlighting (command name / flags / strings / variables / pipes & redirects, each colored separately)
- Terminal confirmation (
/dev/ttyinteraction) + desktop notification (notify-send/osascript) - Installer: safely merges hooks into
settings.json(global / project / custom-path modes) without touching existing config - System-layer probe (
CC-Monitor-probe, eBPF on Linux): tracing of the Claude Code process tree'sexecve/connect(network-only coverage on macOS via nettop, see below) - Bypass detection: fuzzy-matches what the probe observed against hook records (process tree + time window + quote-stripped substring match), flagging
hook_bypass_suspected - Network visibility: eBPF captures
connect()destination IP:port; domain names come from auprobe:libc:getaddrinfothat records the hostname the moment the application resolves it (reverse DNS as a fallback) — no MITM proxy needed - Network byte-count stats:
tcp_sendmsg/tcp_cleanup_rbufkernel probes, aggregated upload/download bytes per (ip, port) - Web UI Network tab: connection detail table + GeoIP location (local MaxMind/DB-IP Lite database) + WebGL2 world map, with connection counts clickable for per-connection time/process/PID detail
- Claude Code identity check: cross-platform (
ps) detection of which OS user everyclaudeprocess runs as, flagged when it differs from the Web UI's own user - Four Home stat cards — tool calls, MCP calls, Skill calls, AI trajectory — all with click-through drilldowns showing Session ID/folder/timestamp
- AI Approvals supports an
action: "notify"rule type (Claude Code clarifying questions, e.g.AskUserQuestion) and keeps a long-term history table, capturing the user's actual terminal answer fornotify-kind records - AI Approvals also covers Claude Code's native
PermissionRequestdialog: operations that matched no rule but that Claude Code's own permission system wants to ask "Do you want to proceed?" about now show up on the page too (kind='permission'); a 90s timeout or pressing Enter at the terminal silently hands the request back to the native dialog — installing CC-Monitor never removes that safety net - Anthropic account profile (name/email/organization/plan/rate-limit tier) read from the local
~/.claude.json, zero network calls - Per-session
Σ Total / Cachedtoken summary on the Status page (same accounting as ccstatusline) - Model Usage table, Limits table, context window usage %, and Context compaction count (real detection, not an estimate) on the Status page
- Home page GitHub Operations stats (push/clone/commit/pull-fetch/gh CLI/other git operations)
- Home page SSH Operations (ssh/scp/sftp/key management/other) and Downloads (wget/curl/aria2/other) cards, classified from Bash command text
- The "AI Trajectory" card and world map now also include command-text-inferred network targets: when Claude runs wget/curl/git clone/ssh/scp/…, the target hostname is extracted from the command, resolved to an IP, and geo-located, then merged alongside real system-layer-probe data with an "inferred" tag (not guaranteed to have actually connected, and no byte counts) — many people never start the probe by hand, so this used to be empty entirely
- World map gained an animated "this machine ↔ destination" arc with a travelling light dot (modeled on BeeEye's approach): each connection draws an arc from a schematic anchor (fixed at (0,0), open ocean — explicitly not this machine's real location; no extra request is made to ask a third party for the public IP just for this) to the destination, with the dot's direction following whichever direction moved more bytes (download-heavy animates back toward the anchor; inferred targets have no real byte counts, so they default to animating outward). Falls back to Canvas 2D when WebGL2 isn't available, so the map never disappears entirely just because WebGL2 is missing — both rendering paths were verified with real screenshots from a headless browser, confirming both the animation and the direction logic
- Terminal Sessions gained a "New Window" button: shares the same working-directory picker
modal as "New Session," the only difference being it never types
claude\rinto the PTY — for when you just want a terminal without being dropped into a Claude Code session.POST /api/sessionstakes alaunchClaude: falseflag; verified over a real WebSocket connection that the "New Window" shell prompt never hasclaudetyped in front of it, while "New Session" does - Home page Screenshot Audit: identifies Bash screenshot CLI commands / image files opened via Read / MCP screenshot-type tool actions; the drilldown shows only basic info (command / file path), never the screenshot's own image content
- New kill/pkill monitoring-tamper detection rules: specifically flags kill/pkill targeting
CC-Monitor's own probe/hook processes (
confirmlevel); a generic kill/pkill islog-only to avoid alert fatigue - Home page Docker Operations stats (run/build/exec/compose/other), classified from Bash command text; run/build/exec are broken out separately since they're a different risk tier than read-only inspection
- Sensitive-file-read detection extended to Bash commands:
cat/less/headand friends reading SSH keys/.env/credential files are now covered (previously only theReadtool opening them directly was), plus new detection forenv/printenv/export -pdumping the whole environment - New
su/pkexecprivilege-escalation detection (same risk category assudo, previously a complete blind spot) - New single-file, non-recursive
chmod 777detection: relative-path, single-file cases weren't covered by any existing rule before - New destructive direct-database-command detection:
mysql/psql/redis-cli/mongo/mongosh/sqlite3followed byDROP/DELETE/TRUNCATE/FLUSHALL/FLUSHDBhad zero rule coverage before - New shell-history-read detection:
cat .bash_history/ running barehistoryhad no rule coverage before — command history can retain plaintext credentials typed in the past - Strengthened reverse-shell/backdoor-execution detection: the previous
reverse_shell_patternonly recognizednc -e— expanded to cover the-cvariant, thencat/netcataliases,socat exec:, and amkfifo-plus-named-pipe reverse shell, verified not to false-positive on ordinary network diagnostics likenc -zv/nmap - New "Archive/Compression Operations" home card (tar/zip/7z/gzip/other), classified from Bash command text
- New "Network Diagnostic Tools" home card (nc/nmap/telnet/other) — a pure visibility stat, a separate concern from the reverse-shell risk judgment
- New "Process Management / Backgrounding" home card (nohup/disown/background job/other) —
"background job" is detected via an isolated trailing
&, deliberately narrowed to avoid false-positiving on the&inside a URL query string - New "Subagent spawns" home card: grouped by
subagent_type, previously buried inside the generic "tool calls" count with no dedicated visibility - Collapsed the GitHub/SSH/Download/Docker/Archive/Network-Diagnostics/Process-Management home cards (33 sub-category cards across 7 rows) down to one summary card per group; clicking one now shows a category breakdown table plus the full command list, the same interaction as the MCP/Skill/Subagent call cards
- New detection for tampering with Claude Code's own config (
settings.json/.claude/hooks//CLAUDE.md) — the biggest anti-bypass gap found so far, since rewriting the config is stealthier than killing the probe process - Docker privileged/mount detection extended to Docker-socket mounts, risk bumped from medium to high
- New secret-format scanning on written content (
secret_pattern_in_write): no longer judged by file path alone — recognizes AWS/GitHub/Anthropic/OpenAI/Slack/Google/npm/Stripe fixed prefixes plus private-key headers;policy.pygained a multi-candidatecontentfield mapping (Write'scontent, Edit'snew_string, NotebookEdit'snew_source) - New git-hooks/git-config persistence-attack-surface detection (
core.hooksPath,url....insteadOf, direct writes into.git/hooks/) — same risk category as the existing crontab/systemd persistence rules, previously a complete blind spot for git - Appearance settings dialog: color-theme swatch grid, interface font, interface font size (new settings)
- Session quota shows "remaining %" with a conky-style stepped palette; weekly quotas show "used %" with a continuous red→yellow→green gradient; per-model quotas like Fable are detected dynamically
- macOS platform support: hooks (
PreToolUse/PostToolUse/PermissionRequest), AI Approvals, usage display (reading credentials from the login Keychain), the Web Terminal (fixed anode-ptyspawn-helper permissions issue), the system-layer network probe (cc_monitor/probe_darwin.py, sampling via the built-innettop, no root needed), and desktop-app approval alerts (Dock bounce + badge + best-effort system notification) all work and have been verified; Linux remains the most polished and thoroughly tested platform
Not implemented / TODO
- macOS system-layer bypass detection (Endpoint Security Framework): the design doc's
// faq
What is CC-Monitor?
Claude Code Monitor : Monitor & audit every action Claude Code takes on your computer.. It is open-source on GitHub.
Is CC-Monitor free to use?
CC-Monitor is open-source under the MIT license, so it is free to use.
What category does CC-Monitor belong to?
CC-Monitor is listed under plugins in the Claudeers registry of Claude-compatible tools.
// embed badge

[](https://claudeers.com/cc-monitor)
// retro hit counter

[](https://claudeers.com/cc-monitor)
// reviews
// guestbook
// related in Claude Plugins
 🔓
🔓A single CLAUDE.md file to improve Claude Code behavior, derived from Andrej Karpathy's observations on LLM coding pitfalls.
 🔓
🔓Claude Code is an agentic coding tool that lives in your terminal, understands your codebase, and helps you code faster by executing routine tasks, explainin…
 🔓
🔓"CLI-Anything: Making ALL Software Agent-Native" -- CLI-Hub: https://clianything.cc/
🔓financial-services — a Claude ecosystem project on GitHub.