
brutal-metrics
Herdr layout: brutalist cost, token and context panel for Claude Code agents
Install with your AI
Paste into Claude Code, Cursor, or any agent — it reads the repo and wires the tool into your project.
Install and set up brutal-metrics (git-clone project) into my current project.
Found on https://claudeers.com/brutal-metrics
Repo: https://github.com/coldtatooine/brutal-metrics
Homepage/docs: —
Detected install method: git-clone → git clone https://github.com/coldtatooine/brutal-metrics
Category: mcp-servers. Platforms: cli, api.
Read the repo's README for exact setup and env vars, then install it and wire it into my project.

Claudeers Health Verdict:
unknown; community-verified: false. Confirm the source before running anything.
git clone https://github.com/coldtatooine/brutal-metrics
// compatibility
| Platforms | cli, api |
|---|---|
| Operating systems | — |
| AI compatibility | claude |
| License | — |
| Pricing | open-source |
| Language | JavaScript |
Brutal Metrics
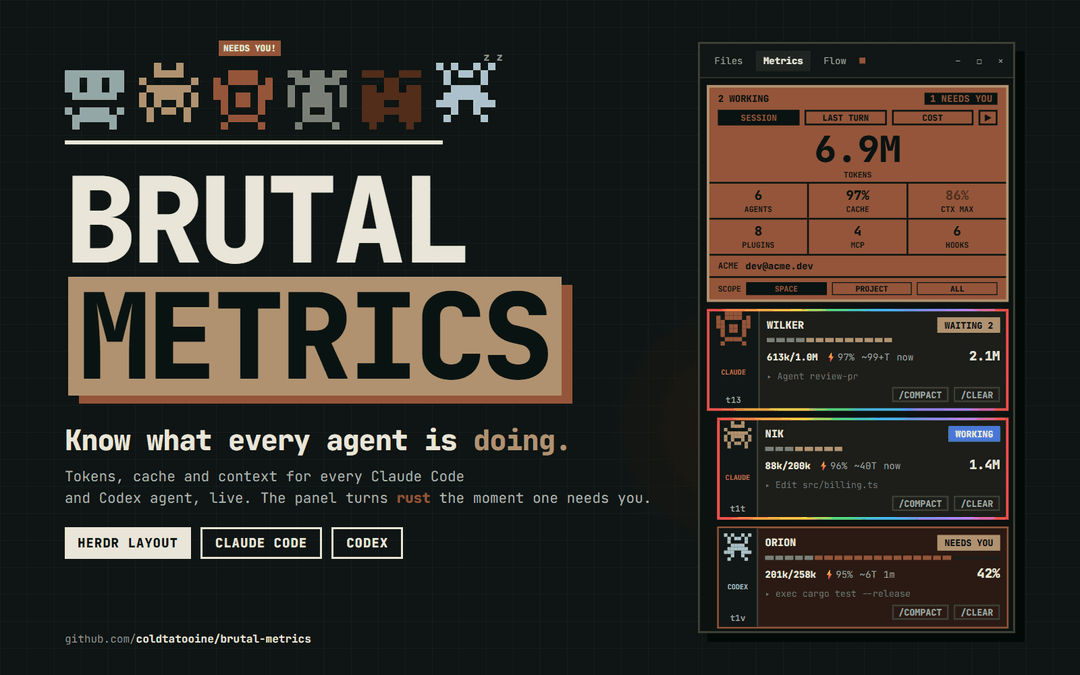
A Herdr layout with a brutalist metrics panel. It shows what each Claude Code or Codex agent in a space is doing: tokens, cache, plan use (Codex), and how full its context window is. No financial cost is shown.
Features
- Summary box at the top of the panel, in compact cells (value over label):
- the tokens of the space, with SESSION, LAST TURN and COST tabs, and the account each session runs as;
AGENTSandCACHE(cache reads as a share of all input tokens), all summed over the space;CTX MAX, the fullest context window among the agents (tinted from 80%);PLUGINS,MCPandHOOKS, the configured items across the agents.
- One card per agent, with sub-agents nested under it:
- a
CLAUDEorCODEXtag; - a thin 24-segment context bar split into base (system prompt, tools, MCP), conversation and free space;
- the context size against the window size, the cache hit rate, an estimate of turns left, and the time since the last turn;
- the tool the agent is running;
- a
/COMPACTbutton (one click) and a two-click/CLEARbutton.
- a
- Alerts: when an agent needs you, the panel turns rust and shows a
blinking
NEEDS YOU. A parent waiting on its sub-agents showsWAITING. - Pixel-art avatars: each agent gets a random sprite, the same in the sidebar and in the panel. Active agents' avatars animate, and working agents get a moving rainbow border.
- Flow tab: a vertical flowchart of the messages the agents send each
other with
hc send. The orchestrator sits on top, linked to every agent; a pulse runs from sender to receiver on each message, and the route stays lit for a few seconds. Each node shows the status, the terminal code and how many messages it sent and received; rest the pointer on the counts for the last messages that node took part in. Only real sends are drawn: if the feed is missing, failed or stale the tab says so (with RETRY) instead of simulating traffic. - Files panel: a lazy file tree of the focused pane's folder, with git status marks and a read-only preview.
- Files, Metrics and Flow buttons in the tab bar open the side panel. Each space remembers which one was open.
Install
Paste this into your coding agent:
Read ~/.config/herdr-app/AGENTS.md, then add this layout: https://github.com/coldtatooine/brutal-metrics
To install it by hand:
- Copy
layouts/brutal-metrics.jsonto~/.config/herdr-app/layouts/. - Copy the five folders in
mods/(agent-metrics,agents-metrics,tabs-metrics,files-metrics,agent-flow) to~/.config/herdr-app/mods/. - Switch to the layout with
ctrl-shift-l, or runherdr-app do layout.switch '{"name":"brutal-metrics"}'.
Your own layout stays as it is. Press ctrl-shift-l to switch back.
Scope, loading and errors
- A play/pause button beside the tabs cycles SESSION, LAST TURN and COST every 8 s; a click on a tab while it plays shows that tab for a full turn of the timer.
- A SCOPE row under the account names picks the agents shown, in both the Metrics and the Flow tabs (one shared switch, the Flow tab has its own row of buttons): SPACE (the shown space, the default), PROJECT (every agent, in any space, whose folder is the focused terminal's) or ALL.
- Nothing reads zero until the collector has answered once: the numbers show
…, cards sayREADING…, and an empty list shows pulsing placeholders. If a read fails, the last data stays and a red bar saysSTALE · READ FAILED: …with a RETRY button; the next refresh (5 s) retries by itself. - The side panel is remembered per space; a space that never had a choice starts with the last one made anywhere, instead of closed.
Headline, hover cards and details
- A one-line headline tops the summary box:
READING…,READ FAILED,NO AGENTS,N WORKINGorALL IDLE; the blinkingNEEDS YOUandWAITINGchips sit beside it. - Rest the pointer on a figure for 250 ms for a hover card: the big figure lists tokens
(or cost) by agent;
AGENTSthe state of each;CACHEandCTX MAXthe figure per agent;PLUGINS,MCPandHOOKSthe names. - Click an agent's name (Metrics card or Flow node) for its detail dialog: model,
account, folder, session, context and base, cache hit, turns left, session and last-turn
tokens, turns, tool calls, last tool, start and last activity, and what is configured.
Buttons: ASK STATUS (types a short status request into the agent),
/COMPACT, OPEN TERMINAL, CLOSE (Esc too).
What the numbers mean
- Two tabs at the top of the box switch the numbers: SESSION (the
default) or LAST TURN. They change the big token count and
CACHE, and the tokens and cache of every card.- Last turn is everything since your last prompt, including the model calls and tool loops it triggered. An idle agent keeps showing its last turn, and a new prompt starts the count from zero.
- Total is the whole session.
CTX MAXis the context size at the last turn.PLUGINS,MCPandHOOKScount what is configured, not what is connected. They are read from the settings files,.claude.json,.mcp.jsonand the enabled plugins. claude.ai cloud connectors are not counted.
Requirements
- Python 3: the metrics come from
mods/agent-metrics/collect.py.- On Windows it runs inside WSL. The distro is set by
DISTRO = "Ubuntu"inmods/agent-metrics/main.js, so edit that if yours has another name. - On other systems it runs with
python3.
- On Windows it runs inside WSL. The distro is set by
- Claude Code or Codex CLI: other agents appear but show
NO DATA. Codex is found next to Claude's folder (~/.codexbeside~/.claude, on Windows or in WSL). Only threads started in the last 7 days and active in the last 2 are read.
What it reads and runs
-
collect.pyonly reads Claude Code's files:~/.claude/sessions/*.jsonand the session transcripts;settings.json,settings.local.json,.mcp.jsonand the enabled plugins'hooks/hooks.jsonand.mcp.json, to count plugins, MCP servers and hooks;~/.claude.jsonor settingsenv, for the account (email, org or credential kind, never a token).
-
It also reads these Codex files, without changing them:
- the rollouts in
~/.codex/sessions/YYYY/MM/DD/, for the folder, model, context window, token totals, the last request's usage, the tool in use and the plan's rate-limit use; session_index.jsonlfor thread names, andconfig.tomlandhooks.jsonto count plugins, MCP servers and hooks. It never readsauth.json. The account shown is the plan type from the rollout.
From the same transcripts and rollouts it also picks up the messages agents send each other with
hc send. Each one arrives as a line starting with<hc from="tN">, either as a prompt or absorbed into a running turn. The last 50 come out asevents:id,seq,ts,from(the sender's hc address),from_name,to_session(the receiver's session; the mod maps it to a terminal asto),kind(send) and a one-linesummaryof at most 60 characters. The full text of the messages is never kept. Acursorcomes with them, andcollect.py --since <cursor>prints only the events after it.It keeps read offsets and the last events in
~/.cache/herdr-metrics.json(HERDR_METRICS_CACHEpoints it at another file, for tests). It makes no network requests. - the rollouts in
-
The mods run
hc getandhc send(/COMPACTand/CLEARsend/compactand/clearto the agent). They also rungit statusand a folder listing for the Files panel.
Notes
- Cost lives in its own COST tab, never in the other two. It is an estimate: what the
session's tokens would cost on the Anthropic API at list price (the
PRICEStable inmods/agent-metrics/main.js), not what a subscription bills. A model missing from the table is priced as its family's current model and shows with a~. Tokens are input + output + cache writes.node scripts/test-cost.mjschecks the math. - Codex on a ChatGPT plan: its card shows the share of the plan's rate limit used in place of the token figure.
- A terminal is paired only with a session of its own kind: Claude with Claude, Codex with Codex. The kind comes from what the agent reports to Herdr.
- The panel shows each session's login email. Keep that in mind before you share a screenshot.
- Message events only cover messages that reached a Claude Code or Codex agent
and were written to its transcript or rollout. These are not seen: messages to other programs, sends that never arrived
(an agent starting up or blocked), and text typed without an hc tag
(including with
notes = falsein hc's config). A tag pasted by hand counts as a message. A message sent while the receiver is busy shows up when the receiver takes it in.
See RECIPE.md for the full spec, which an agent can use to rebuild the layout from scratch.
Tests
node --test tests/model.test.mjs tests/flow.test.mjs covers mods/agent-metrics/model.js (formatting,
window, cost, turns left, pairing terminals with sessions, the detail dialog's rows), scope.js, and the
Flow tab's feed.js and flow.js (feed state, replies, orchestrator, geometry); it also checks that the
copies of avatar.js and scope.js stay identical. node scripts/test-cost.mjs checks the cost
math against Claude Code's /usage and the collector's cache-write split. Check a mod with
herdr-app check <mod folder>; node --check misses QuickJS-only errors.
// faq
What is brutal-metrics?
Herdr layout: brutalist cost, token and context panel for Claude Code agents. It is open-source on GitHub.
Is brutal-metrics free to use?
brutal-metrics is open-source, so it is free to use.
What category does brutal-metrics belong to?
brutal-metrics is listed under mcp-servers in the Claudeers registry of Claude-compatible tools.
// embed badge

[](https://claudeers.com/brutal-metrics)
// retro hit counter

[](https://claudeers.com/brutal-metrics)
// reviews
// guestbook
// related in MCP Servers
 🔓
f.k.a. Awesome ChatGPT Prompts. Share, discover, and collect prompts from the community. Free and open source — self-host for your organization with complete…
 🔓
A cross-platform desktop All-in-One assistant for Claude Code, Codex, OpenCode, OpenClaw, Gemini CLI & Hermes Agent. Only official website: ccswitch.io
 🔓
🪨 why use many token when few token do trick — Claude Code skill that cuts 65% of tokens by talking like caveman
 🔓
An open-source AI agent that brings the power of Gemini directly into your terminal.