
anthropometer
Btop-style real-time context monitor for Claude Code sessions — live context map, cache economics, subagents, and a compiled PDF report.
Install with your AI
Paste into Claude Code, Cursor, or any agent — it reads the repo and wires the tool into your project.
Install and set up anthropometer (release-binary project) into my current project.
Found on https://claudeers.com/anthropometer
Repo: https://github.com/arian-shamaei/anthropometer
Homepage/docs: https://github.com/arian-shamaei/anthropometer#readme
Detected install method: release-binary → inspect the README
Category: devtools. Platforms: cli, api.
Read the repo's README for exact setup and env vars, then install it and wire it into my project.

Claudeers Health Verdict:
active; community-verified: false. Confirm the source before running anything.
Grab the latest release asset from GitHub.
# download a build from https://github.com/arian-shamaei/anthropometer/releases
git clone https://github.com/arian-shamaei/anthropometer
// compatibility
| Platforms | cli, api |
|---|---|
| Operating systems | — |
| AI compatibility | claude |
| License | MIT |
| Pricing | open-source |
| Language | Rust |
anthropometer · amtr
A btop-style, real-time diagnostic instrument for Claude Code sessions.
amtr attaches to a Claude Code session's transcript and renders — live — exactly
what is happening inside the model's context window: how the token budget is being
spent, which files and tools are resident, when compactions fire, what subagents
are doing, and the true cost of every turn. Press R and it compiles a
ground-truth PDF report of the whole session.
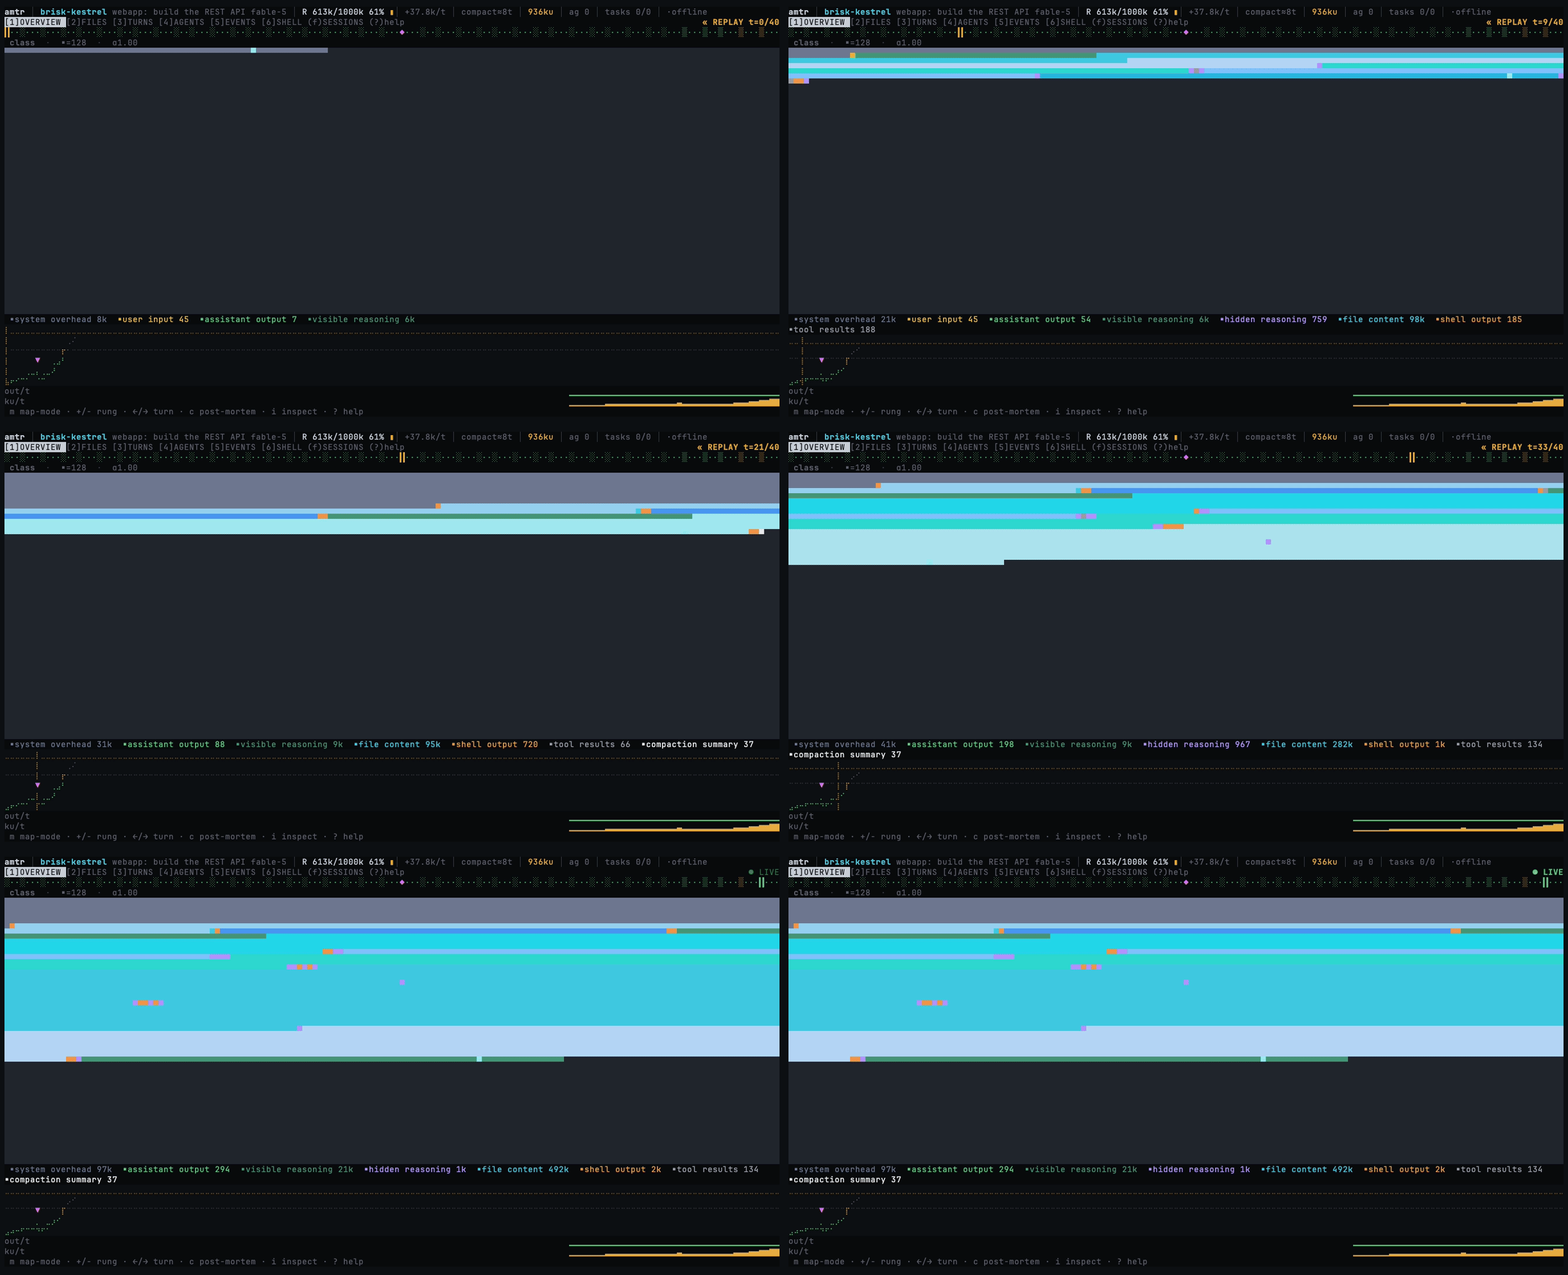
↑ replaying a session turn-by-turn: the context map fills, the composition shifts, the trend climbs.
· · Rust + ratatui TUI · Python engine · terminal-only
AI usage
 hand-written ▕█████████████████████████████████████████████████████████ ▏  vibe coded
              └── none ──── copilot ──── pair-programmed ──── VIBE CODED ──┘
Why
/context gives you one number. amtr gives you the whole picture, continuously:
the context window as a live memory map, file access as a traffic seismograph,
cache economics as a per-turn ledger, compactions as forensic events, and
subagents as an economics table — every quantity labeled authoritative
(read straight from the API usage records) or estimated, never blurred together.
It works on any Claude Code session — interactive or headless (claude -p) — because
every session already writes a complete transcript. amtr just reads it in real time.
The live TUI
A fast, keyboard-driven terminal UI. Tabs 1–6, f for the session picker,
i to inspect, R to build a report, ? for help, q to quit.
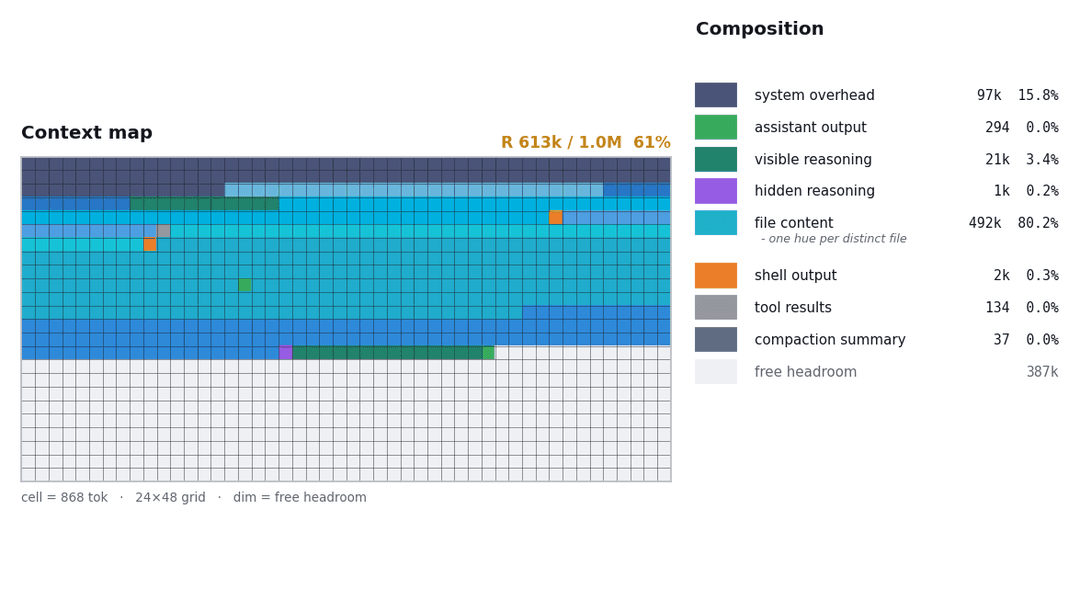
Context map — where your budget actually goes
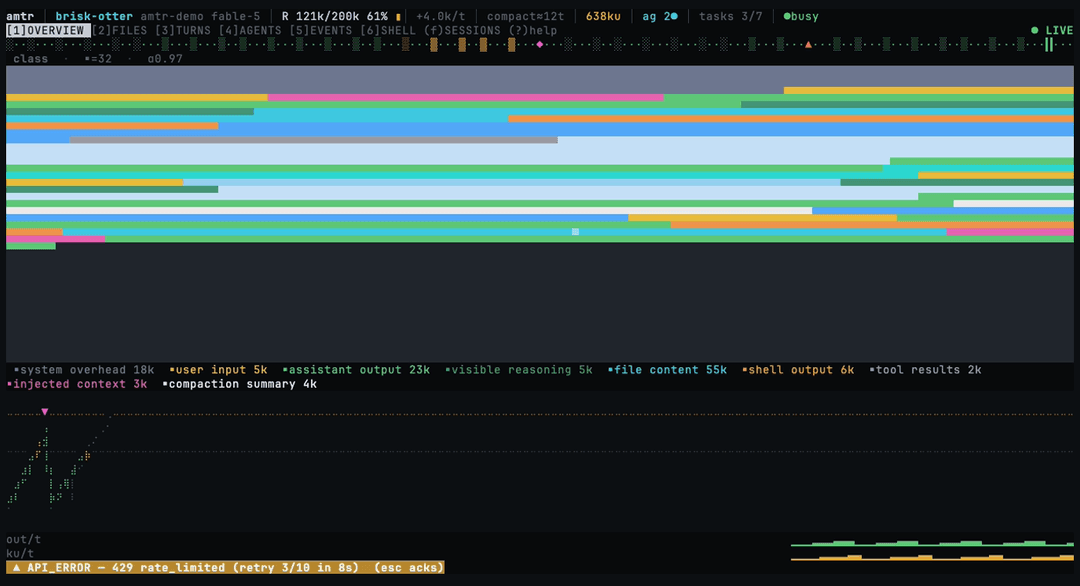
The resident context as a fixed-scale grid: the whole box is the budget, and
every cell is colored by what occupies it — system overhead, file content, hidden
reasoning, shell output, tool results, and more. At a glance you see how full you
are and what's filling you up. m cycles four lenses (category · access-heat ·
turn-age · cache billing); i walks the segments like a memory debugger and reads
back the actual text occupying any region.
Files & subagents
Live file traffic (2) | Subagent fan-out (4) |
|---|---|
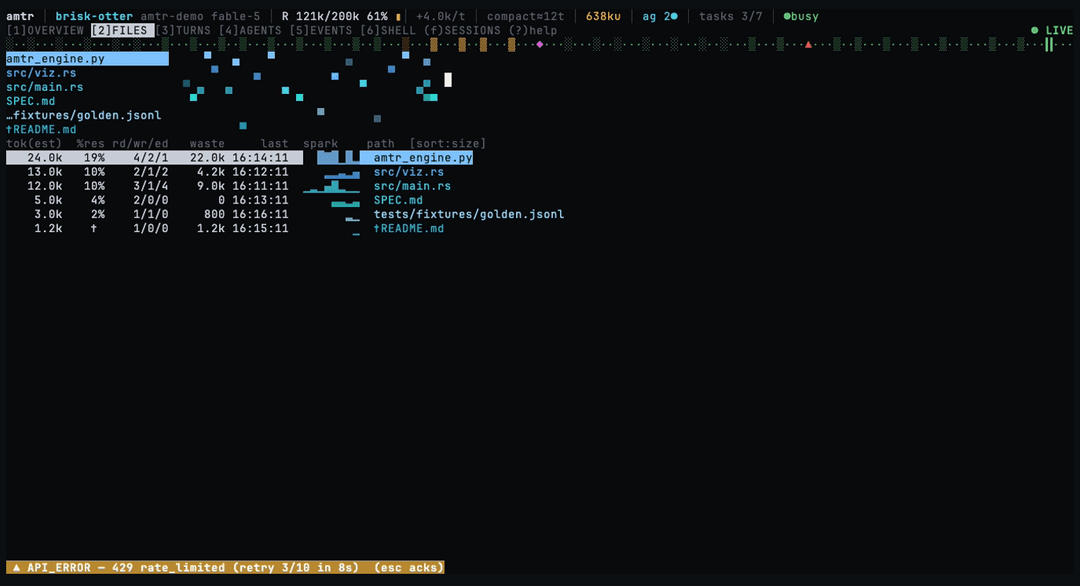 | 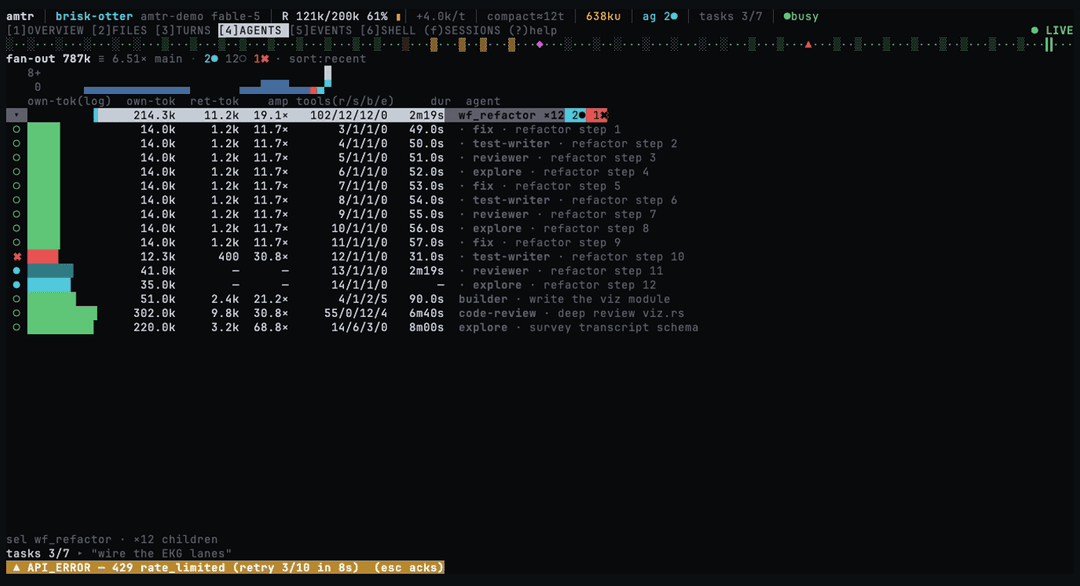 |
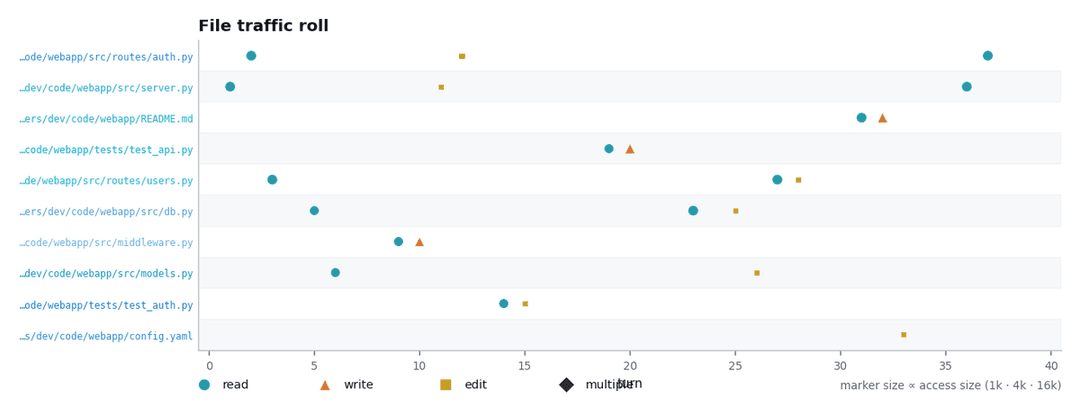
FILES shows every file's read/write/edit history and a "now" view of what's being touched this instant (fading on a heat law), with a waste column that prices re-reads. AGENTS is a concurrency load-strip over a ledger of each subagent's own-tokens, return-tokens, amplification, and live duration.
Session picker — find any session by name or path
Press f for a searchable, scrollable list of every session on your machine
(live ones first). Type to filter by name or project; paste a .jsonl path or a
session id to jump straight to it.
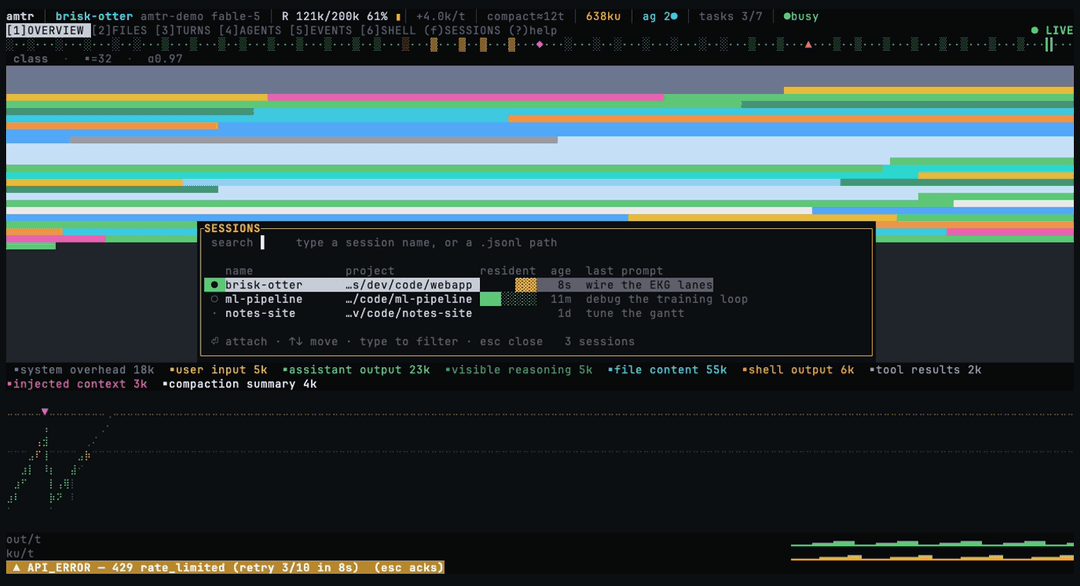
Other tabs: TURNS (per-turn stacked cache/input columns with the 5m/1h billing
split), SHELL (the command console Claude never shows you + the external-retrieval
feed), and EVENTS (compactions, API errors, model fallbacks — with a compaction
post-mortem on Enter). A timeline scrubber holds the whole session; ←/→ rewinds
every view to any past turn.
The report — press R
amtr turns a session's transcript into a compiled, ground-truth PDF report:
a self-contained directory with report.pdf, animated GIFs + static figures, and a
per-turn capture (turns.jsonl / turns.md). Everything is rendered locally.
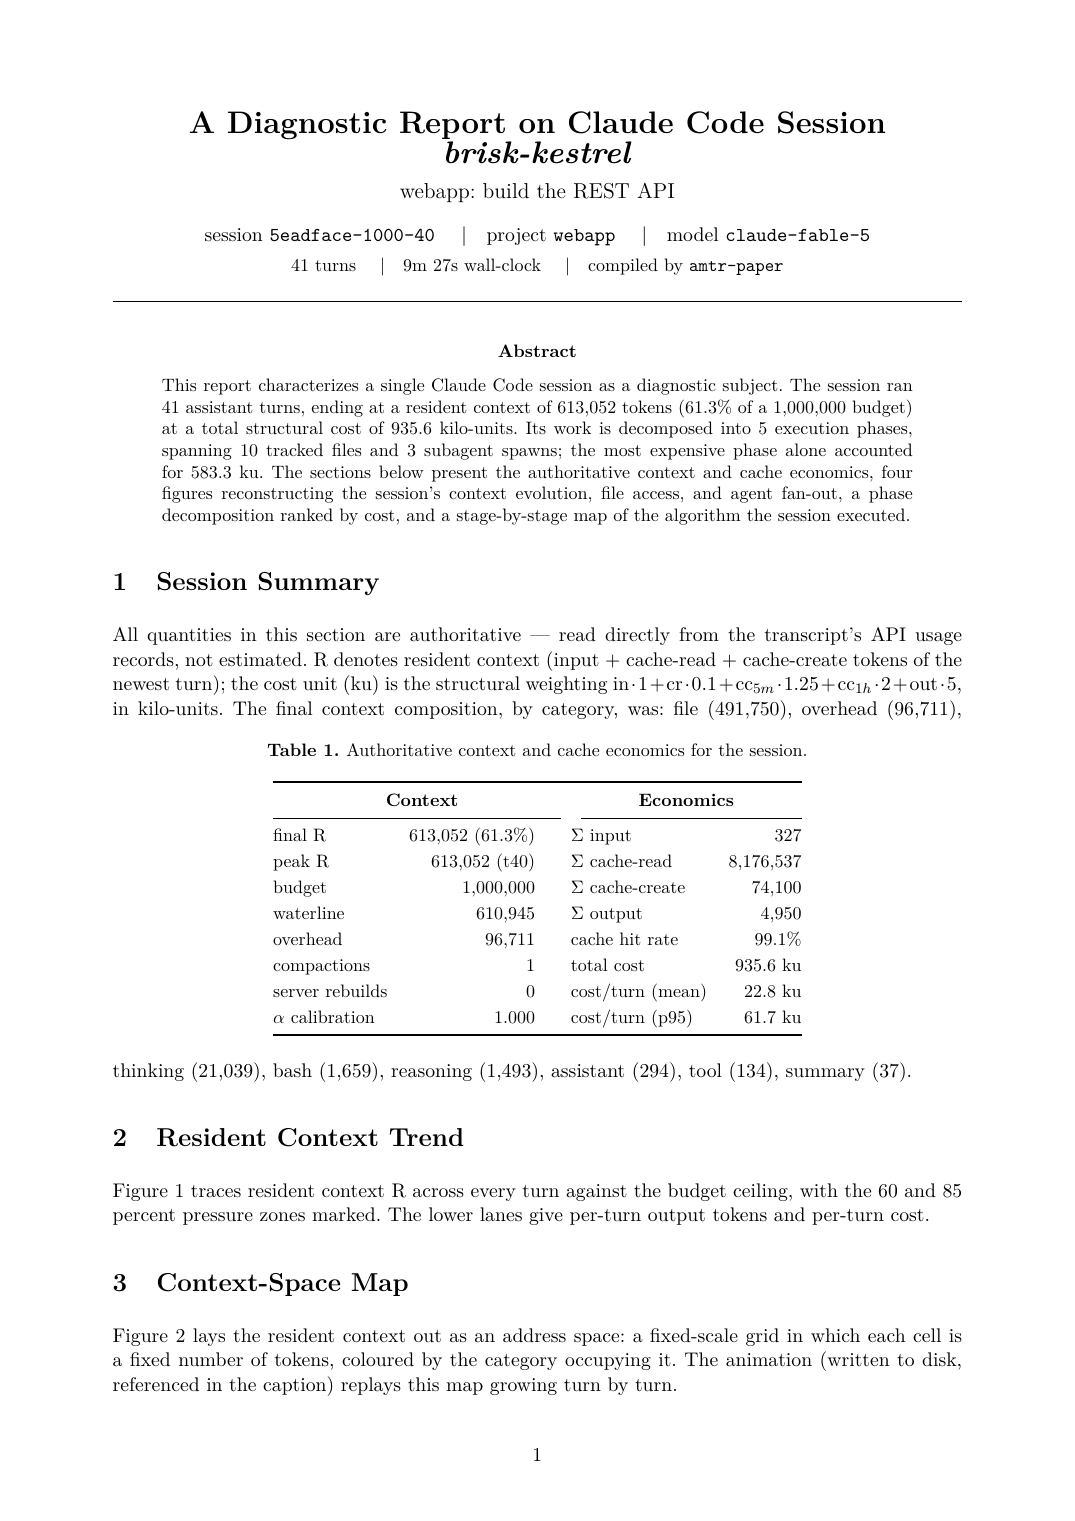
The figures reconstruct the session faithfully:
| Context map | File traffic roll |
|---|---|
 |  |
| Subagent branch tree | Agent fan-out timeline |
|---|---|
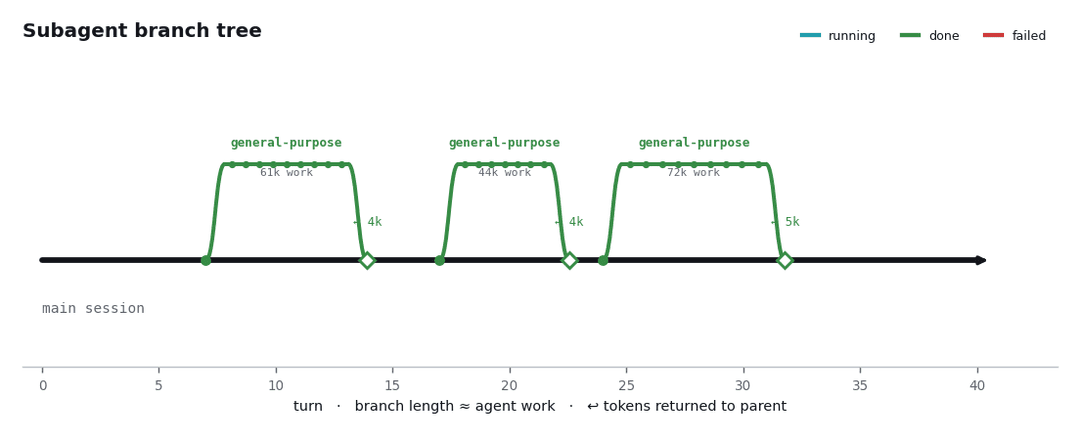 | 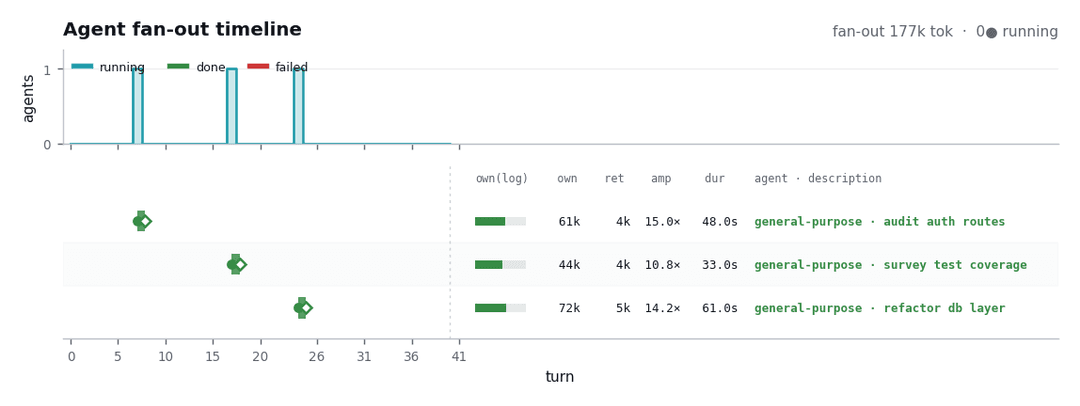 |
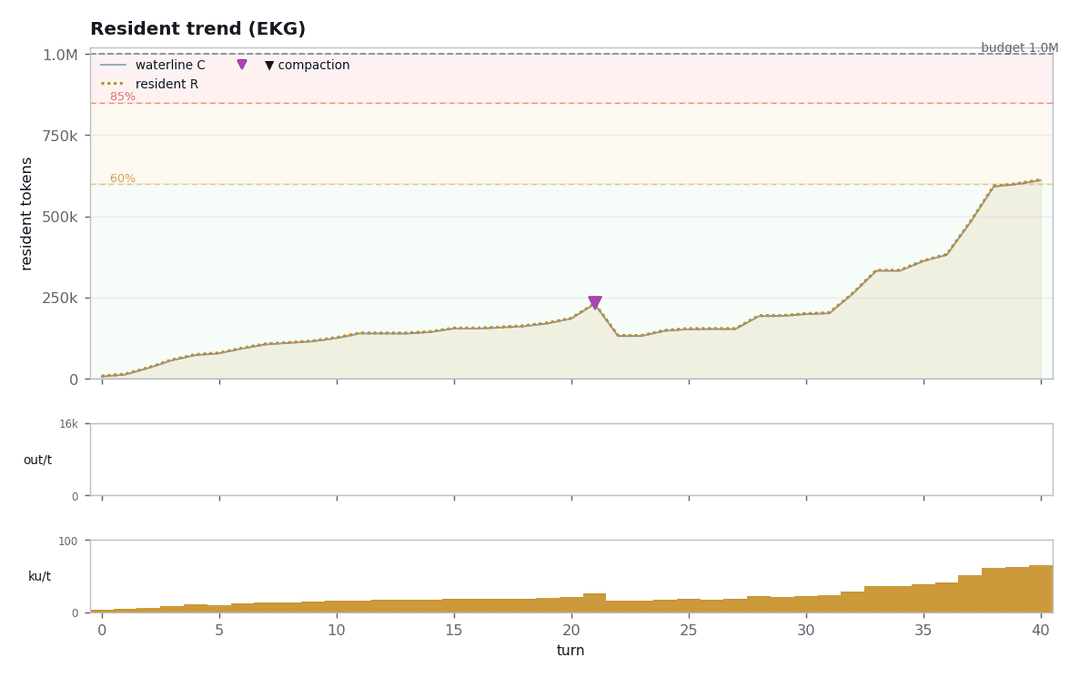
Plus a cost-ranked phase table and a stage-by-stage, turn-by-turn account of what the session actually did.
Install
Quick install (prebuilt binary)
No Rust, no Homebrew — one line downloads the binary + engine for your platform
(macOS arm64/x86_64, Linux x86_64/arm64) and installs it under ~/.local:
curl -fsSL https://raw.githubusercontent.com/arian-shamaei/anthropometer/main/install.sh | sh
If ~/.local/bin isn't on your PATH, the installer tells you how to add it.
Override the install prefix with AMTR_PREFIX or pin a version with AMTR_VERSION.
The live TUI needs only python3 (≥3.9, stdlib); the report extras (R) still
need pip install matplotlib pillow plus brew install tectonic.
Homebrew (recommended)
brew tap arian-shamaei/anthropometer
brew trust arian-shamaei/anthropometer   # newer Homebrew asks you to trust third-party taps
brew install amtr
This installs the live TUI (a small Rust binary + a stdlib Python engine — no
heavy dependencies). To enable the report feature (R / amtr-paper):
pip install matplotlib pillow      # figures
brew install tectonic              # LaTeX → PDF
From source
Needs Rust and Python 3.9+.
git clone https://github.com/arian-shamaei/anthropometer
cd anthropometer/rust
cargo install --path .             # → ~/.cargo/bin/amtr
The engine path is baked in at build time (overridable with $AMTR_ENGINE), so
amtr runs from any directory.
Usage
amtr                       # newest/active session, from anywhere
amtr --session S.jsonl     # a specific transcript
amtr --project ~/my/repo   # newest session for that project
amtr --demo                # a self-contained demo (no live session needed)
Arm it beside a headless run to get a report the moment it finishes:
claude -p "do the thing" &
amtr-report --watch        # tails the live session; prints the report when it ends
Keys: 1–6 tabs · f sessions · i inspect · m map mode · ←/→ scrub ·
R report · ? help · q quit.
Authoritative vs. estimated
amtr is careful about what it knows versus what it estimates:
- R (resident context) — exact:
input + cache_read + cache_creationof the newest assistantusagerecord (the same quantity/contextreports). - The cache waterline — exact:
cache_read_input_tokens; backward jumps are real prefix invalidations (thrash). - Per-item allocations — estimated (
chars/3.8), laid out in true prompt order and force-fit to sum exactly to R, with the invisible server-side context (system prompt, tool schemas) carried as an honest overhead segment and a displayed calibration factorα. - Compaction attribution — from
compact_boundaryset-difference, cross-checked against pre/post token counts.
How it works
Two processes over newline-delimited JSON: a Rust/ratatui UI that owns only the
terminal, and a Python engine that owns all the data (transcript discovery,
tailing, accounting, checkpoints, replay). SPEC.md is the normative contract;
both sides are implemented against it alone, and cross-process contract tests spawn
the real engine and require every emitted line to parse.
┌───────────────────────────┐   JSON lines over stdin/stdout   ┌───────────────────────────┐
│  amtr  (Rust ratatui bin) │ ── Control (UI → Engine) ──▶      │  amtr_engine.py           │
│  owns ONLY the terminal   │                                  │  (python3 ≥3.9, stdlib)   │
└───────────────────────────┘ ◀── Update (Engine → UI) ──       │  owns ALL data            │
                                                                └───────────────────────────┘
Repository layout
SPEC.md            the normative protocol + view contract
amtr_engine.py     the engine: discovery, tailing, accounting, checkpoints, replay
amtr_paper.py      the PDF report builder (amtr_figures/_turns/_phases support it)
rust/              the TUI (cargo test runs a headless screenshot suite)
tests/             engine test suite + synthetic fixtures
packaging/homebrew the Homebrew formula + tap runbook
docs/assets/       screenshots and figures for this README
License
MIT © Arian Shamaei
// faq
What is anthropometer?
Btop-style real-time context monitor for Claude Code sessions — live context map, cache economics, subagents, and a compiled PDF report.. It is open-source on GitHub.
Is anthropometer free to use?
anthropometer is open-source under the MIT license, so it is free to use.
What category does anthropometer belong to?
anthropometer is listed under devtools in the Claudeers registry of Claude-compatible tools.
// embed badge

[](https://claudeers.com/anthropometer)
// retro hit counter

[](https://claudeers.com/anthropometer)
// reviews
// guestbook
// related in Developer Tools
 🔓
🔓The agent harness performance optimization system. Skills, instincts, memory, security, and research-first development for Claude Code, Codex, Opencode, Curs…
 🔓
🔓Makes your AI agent think like the laziest senior dev in the room. The best code is the code you never wrote.
 🔓
🔓Use Garry Tan's exact Claude Code setup: 23 opinionated tools that serve as CEO, Designer, Eng Manager, Release Manager, Doc Engineer, and QA
 🔓
🔓AI coding assistant skill (Claude Code, Codex, OpenCode, Cursor, Gemini CLI, and more). Turn any folder of code, SQL schemas, R scripts, shell scripts, docs,…