
agent-observability
Self-hosted OpenTelemetry observability stack for AI coding agents (Claude Code + OpenAI Codex). All telemetry stays local — OTel Collector → Prometheus + Lo…
Install with your AI
Paste into Claude Code, Cursor, or any agent — it reads the repo and wires the tool into your project.
Install and set up agent-observability (git-clone project) into my current project.
Found on https://claudeers.com/agent-observability
Repo: https://github.com/KB1SLN-Labs/agent-observability
Homepage/docs: —
Detected install method: git-clone → git clone https://github.com/KB1SLN-Labs/agent-observability
Category: mcp-servers. Platforms: cli, api, desktop, web.
Read the repo's README for exact setup and env vars, then install it and wire it into my project.

Claudeers Health Verdict:
slowing; community-verified: false. Confirm the source before running anything.
git clone https://github.com/KB1SLN-Labs/agent-observability
// compatibility
| Platforms | cli, api, desktop, web |
|---|---|
| Operating systems | — |
| AI compatibility | claude |
| License | — |
| Pricing | open-source |
| Language | Go Template |
agent-observability
A self-hosted observability stack for AI coding agents. It collects the OpenTelemetry data that Claude Code and OpenAI Codex already emit — model requests, tool executions, prompts, edits, tokens, and session activity — stores it locally, and surfaces it as ready-made Grafana dashboards. Everything stays in your own environment; nothing is sent to Anthropic, OpenAI, or any third party.
The repo contains everything needed to stand the stack up: the OpenTelemetry Collector, Prometheus, Loki, and Grafana configs, deployment manifests for Docker Compose / Kubernetes / Helm, and pre-built dashboards for each supported agent. Point an agent's OTel exporter at the collector and its dashboard fills in.
Stack: OpenTelemetry Collector → Prometheus (metrics) + Loki (logs) + Tempo (traces) → Grafana
Supported agents and dashboards:
| Agent | Dashboard(s) | Data |
|---|---|---|
| Claude Code | Claude Code + Claude Code — Logs | Cost (API-equivalent), tokens, cache, productivity, tools/skills/MCP, performance |
| OpenAI Codex | Codex + Codex — Logs | Sessions, tokens, latency, tools & decisions — covering both the Codex CLI and the desktop app |
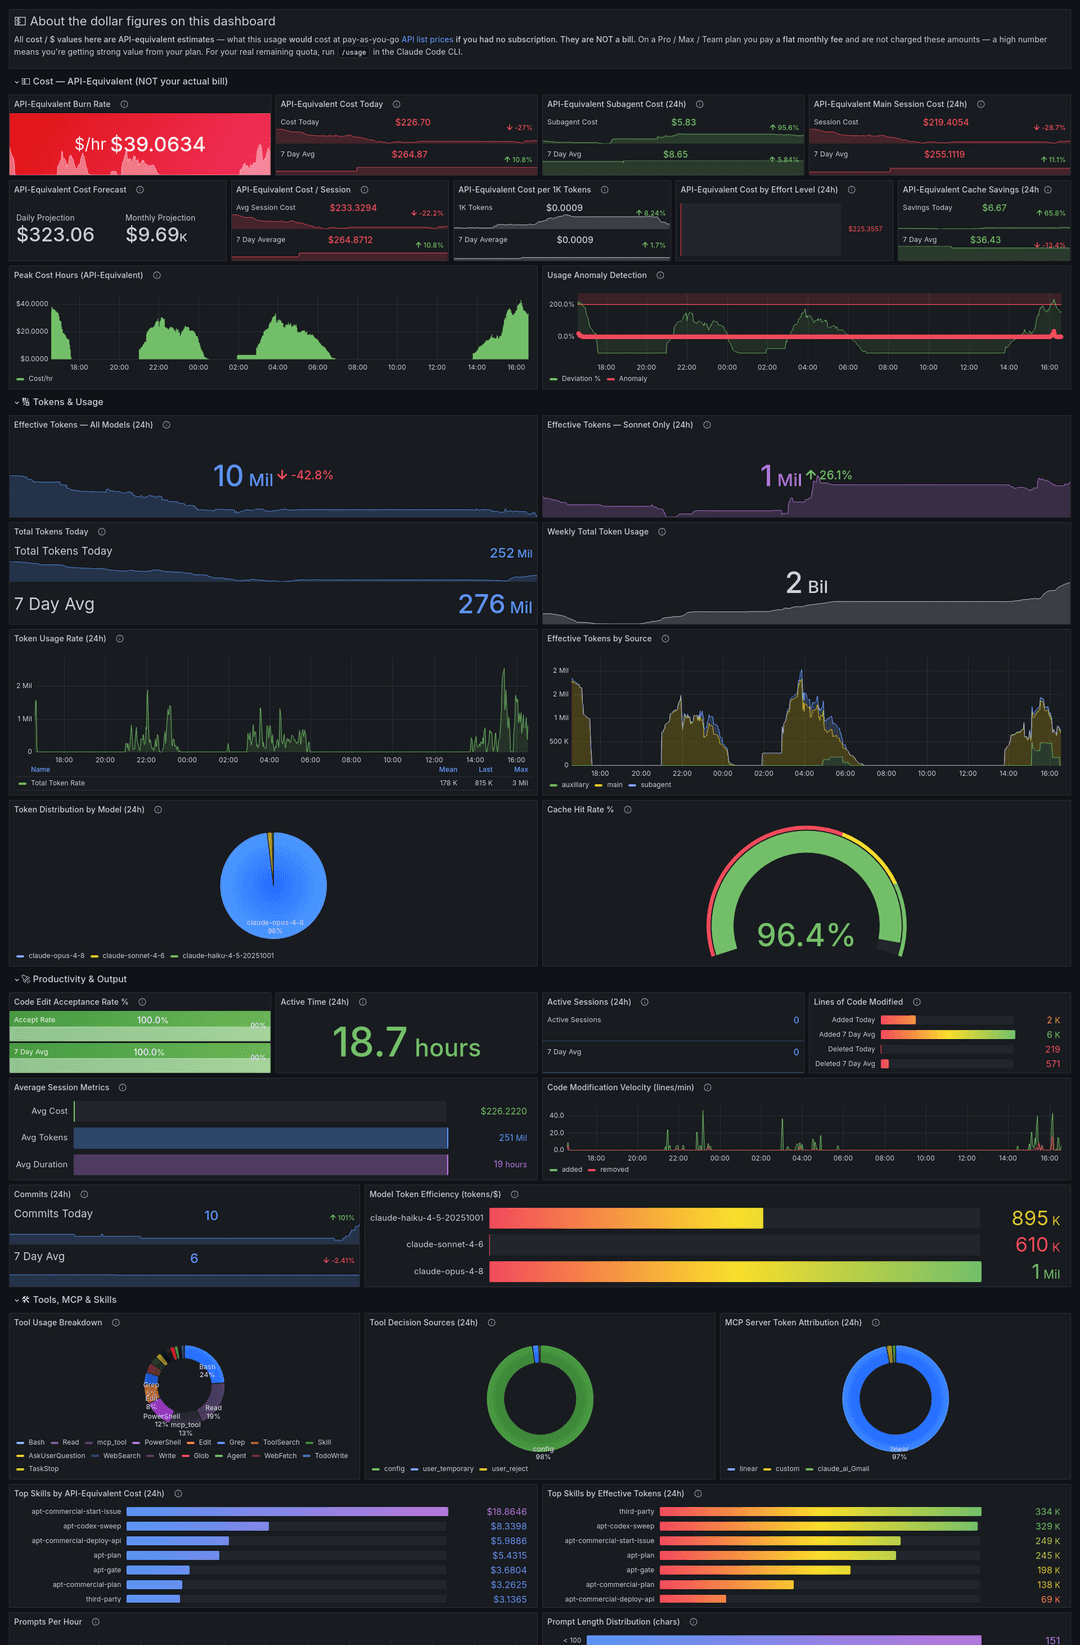
Above: the Claude Code dashboard. See the Dashboard reference for the full Claude Code and Codex dashboards.
💵 A note on the cost figures (Claude Code)
Every dollar amount on the Claude Code dashboard is API-equivalent cost — what your usage would cost at pay-as-you-go API list prices if you had no subscription. It is not a bill. Claude Code computes this estimate on every request (the metric is literally documented as "cost_usd: Estimated cost in USD") regardless of how you're billed. If you're on a Pro / Max / Team plan you pay a flat monthly fee and are not charged these amounts — a high number means you're extracting strong value from your plan. Only metered API / Console users actually pay per token. The dashboard makes this explicit with a banner and panel labels so the numbers are never mistaken for money owed. (Codex telemetry carries no cost data, so the Codex dashboard tracks usage and performance, not spend.)
What you get
Across both agents:
- Token usage broken out by type, source, and model, with rate and trend over time
- Tool-call breakdown by type, plus how each execution was authorized (decisions / approval source)
- MCP server attribution, prompt frequency, and session/conversation activity
- Response latency (p95) and error/failure counts
- Raw filterable log stream per agent, with session drill-down and full structured payloads
- Every panel respects the dashboard time picker (with a few intentional fixed-window panels)
Claude Code specifically:
- Real-time API-equivalent cost burn rate, daily/monthly projections, and hourly anomaly detection
- Subagent vs. main-session cost split, cache hit rate, cache-savings estimate, and cost per 1K tokens
- Per-model token efficiency (tokens per dollar across Haiku, Sonnet, Opus), and cost/token attribution by skill, MCP server, and effort level
- Lines of code added/removed, commits, edit-acceptance rate, and modification velocity
Codex specifically:
- Conversation, turn, and prompt activity across the Codex CLI and desktop app
- Input/output/cached/reasoning token breakdown, and tokens by surface
- WebSocket/SSE turn latency, transport errors, and tool success rate
- Code-activity proxies (git commands, commits, file edits) derived from Codex's shell command stream, since Codex emits no native git telemetry
Deployment options
Three ways to run the stack — pick the one that matches your environment. You only need one.
| Option | What you need | Best for |
|---|---|---|
| Docker Compose | Docker and Docker Compose | Quickest start. Single machine, local or remote. No Kubernetes needed. |
| Kubernetes (Kustomize) | A cluster and kubectl v1.14+ | Existing cluster without Helm. Raw manifests that are easy to inspect and edit. |
| Helm | A cluster and Helm v3 | Existing cluster with Helm. Cleanest to customize and upgrade. |
All three options deploy the same five services and the same Grafana dashboards. Each section below includes a clone step — start there regardless of which option you choose.
Already running an earlier version? Skip the install steps and jump to Upgrading an existing deployment for per-method update instructions (no data is lost).
How it works
Claude Code and Codex both have built-in support for OpenTelemetry (OTel) — an open standard for exporting telemetry from applications. When OTel export is enabled, the agents send three streams of data continuously throughout their operation — not just on API calls, but on every tool execution, prompt, edit, and authorization event:
- Metrics — structured numeric data: token counts, cost, cache hits, session duration, code lines changed, tool call counts, and more. These flow through the OTel Collector into Prometheus, where Grafana queries them to build the dashboard panels.
- Logs — structured event records: every tool execution, user prompt, edit acceptance or rejection, and decision authorization. These flow through the OTel Collector into Loki, where Grafana queries them for the log explorer and log-sourced panels.
- Traces — spans around each model request and tool execution, capturing timing and the parent/child structure of a turn. These flow through the OTel Collector into Tempo. Tempo derives latency (span) metrics from them into Prometheus, and the raw traces are explorable in Grafana.
The services and how they connect:
Claude Code / Codex
    │
    │  OTLP/HTTP (port 4318)  — metrics, logs, traces
    ▼
OTel Collector
    ├── metrics ──► Prometheus ──┐
    │                            │
    ├── logs ─────► Loki ────────┼──► Grafana
    │                            │
    └── traces ───► Tempo ───────┘
                      └── span metrics ──► Prometheus
Both agents emit all three OpenTelemetry signals — metrics, logs, and traces — and the collector routes each to the matching backend: Prometheus for metrics, Loki for logs, and Tempo for traces. Tempo also derives RED span metrics (latency histograms, request/error counts) from traces and remote-writes them to Prometheus, so trace-based latency can be charted with PromQL.
The OTel Collector is the only service that needs to be reachable from wherever you run the agents. Prometheus, Loki, Tempo, and Grafana communicate with each other internally. Grafana is the only service you need to reach in a browser.
Configuring Claude Code
This configuration is the same regardless of which deployment option you chose. The only thing that differs is the endpoint URL — each deployment section calls out what to use.
OTel export is built into Claude Code with no plugins or extensions required. If you're on an older installation, run claude update to get the latest version before proceeding.
Settings
Claude Code's settings.json supports an env block that sets environment variables for the process at startup. Add the following, replacing <your-collector-host> with the endpoint for your deployment:
{
  "env": {
    "CLAUDE_CODE_ENABLE_TELEMETRY": "1",
    "CLAUDE_CODE_ENHANCED_TELEMETRY_BETA": "1",
    "OTEL_METRICS_EXPORTER": "otlp",
    "OTEL_LOGS_EXPORTER": "otlp",
    "OTEL_TRACES_EXPORTER": "otlp",
    "OTEL_EXPORTER_OTLP_PROTOCOL": "http/protobuf",
    "OTEL_EXPORTER_OTLP_ENDPOINT": "http://<your-collector-host>:4318"
  }
}
CLAUDE_CODE_ENABLE_TELEMETRY — the master switch; telemetry is off until this is "1".
OTEL_METRICS_EXPORTER / OTEL_LOGS_EXPORTER / OTEL_TRACES_EXPORTER — turn on each signal. Metrics drive most dashboard panels and logs drive the tool/prompt/error panels and the Logs dashboard, so both are needed for the full dashboard. Traces are optional — they feed the trace-derived latency panels (and Grafana's Tempo explorer); leave OTEL_TRACES_EXPORTER out if you don't want them.
CLAUDE_CODE_ENHANCED_TELEMETRY_BETA — required to enable traces (tracing is gated behind this beta flag). Omit it if you're not exporting traces.
OTEL_EXPORTER_OTLP_ENDPOINT — the base URL of the OTel Collector. Claude Code appends /v1/metrics, /v1/logs, and /v1/traces automatically. Use http://localhost:4318 if the stack is on the same machine as Claude Code, or http://<host>:4318 if it's running elsewhere.
OTEL_EXPORTER_OTLP_PROTOCOL — must be http/protobuf. The gRPC protocol is also supported by the collector on port 4317 but is not needed for most setups.
Optional: add
"OTEL_EXPORTER_OTLP_METRICS_TEMPORALITY_PREFERENCE": "cumulative"to keep metric counters cumulative (the form Prometheus expects). Claude Code's default already works with the collector, but setting it explicitly avoids any ambiguity if you also fan out to a delta-based backend.
Where is settings.json?
| Platform | Path |
|---|---|
| macOS / Linux | ~/.claude/settings.json |
| Windows | %USERPROFILE%\.claude\settings.json |
If the file doesn't exist yet, create it with the env block above. If it already exists, add the env block alongside your existing settings — don't replace the whole file:
{
  "theme": "dark",
  "env": {
    "CLAUDE_CODE_ENABLE_TELEMETRY": "1",
    "CLAUDE_CODE_ENHANCED_TELEMETRY_BETA": "1",
    "OTEL_METRICS_EXPORTER": "otlp",
    "OTEL_LOGS_EXPORTER": "otlp",
    "OTEL_TRACES_EXPORTER": "otlp",
    "OTEL_EXPORTER_OTLP_PROTOCOL": "http/protobuf",
    "OTEL_EXPORTER_OTLP_ENDPOINT": "http://<your-collector-host>:4318"
  }
}
After saving, restart Claude Code. New sessions will begin exporting telemetry immediately; any sessions that were open when you saved need to be closed and reopened. (Like the Codex desktop app, an already-running Claude session keeps its old telemetry config until restarted.)
Verifying it's working
Open Grafana and check the main dashboard. Within a few minutes of running Claude Code you should see non-zero values in API-Equivalent Cost, Total Tokens, and Active Sessions. The Log Stream on the Logs dashboard should show entries as well. If you enabled traces, Explore → Tempo will show Claude Code traces after a turn or two.
If panels stay empty after several minutes, see Troubleshooting.
Configuring Codex
The stack also ships a Codex dashboard. OpenAI Codex has built-in OpenTelemetry support and exports structured log events for conversations, prompts, model turns (with token counts), tool calls, and decisions. Pointing Codex at the same OTel Collector makes its data appear in the Codex dashboard. This works for both the Codex CLI and the Codex desktop app, which share the same config.toml (service names codex_exec and codex-app-server respectively).
The two surfaces emit mostly the same events, with one confirmed difference: time-to-first-token (codex.turn_ttft) is emitted only by the desktop app, not the CLI. So the TTFT / response-latency panels populate only when you use the desktop app — CLI-only usage will leave those specific panels empty while everything else (conversations, tokens, tools, decisions) still fills in.
Settings
Codex is configured via ~/.codex/config.toml (%USERPROFILE%\.codex\config.toml on Windows). Add an [otel] block pointing the log exporter at your collector's OTLP HTTP logs endpoint:
[otel]
environment = "prod"
log_user_prompt = false   # keep prompt text out of telemetry; prompt_length is still recorded

[otel.exporter.otlp-http]            # logs   -> Loki
endpoint = "http://<your-collector-host>:4318/v1/logs"
protocol = "binary"

[otel.metrics_exporter.otlp-http]    # metrics -> Prometheus
endpoint = "http://<your-collector-host>:4318/v1/metrics"
protocol = "binary"

[otel.trace_exporter.otlp-http]      # traces -> Tempo
endpoint = "http://<your-collector-host>:4318/v1/traces"
protocol = "binary"
endpoint — each exporter points at the collector's matching OTLP HTTP path. Unlike Claude Code (which appends the signal path automatically), Codex's exporters take the full path (/v1/logs, /v1/metrics, /v1/traces). Use http://localhost:4318/... if the stack is on the same machine, or the collector's host/IP otherwise.
protocol = "binary" — OTLP protobuf over HTTP, which the collector accepts on port 4318.
log_user_prompt = false — recommended. Codex records prompt_length regardless, so the Prompt-per-hour panel works without capturing prompt contents.
Most Codex panels are built from logs (conversations, tokens, tools, decisions), so the logs exporter alone covers the bulk of the dashboard. Adding the traces exporter feeds the trace-derived operation-latency panels (and Grafana's Tempo explorer) — these come from CLI traces, so they work without the desktop. The metrics exporter is only emitted by the interactive/desktop app (see the note below); it isn't required for the shipped panels. Codex's telemetry carries no per-request dollar cost, so the dashboard tracks usage and performance, not spend.
Note on signal coverage by entry point. Per OpenAI's instrumentation, the interactive Codex app emits all three signals (metrics, logs, traces);
codex exec(the headless CLI) emits logs and traces but no metrics; andcodex mcp-serveremits nothing. So metric-based panels populate only from interactive/desktop usage, and (as noted above)codex.turn_ttftis desktop-only.
After saving, restart Codex so it re-reads the config. For the CLI, just start a new codex session.
For the desktop app, be aware that closing the window is not enough — the desktop keeps background processes running that hold the old telemetry config in memory, so it will keep exporting to the previous endpoint until those are killed. Fully exit the app (end every Codex / codex process — check Task Manager on Windows, since closing the window leaves the app server running) and relaunch it. If the desktop app's data isn't appearing after a config change, a lingering background process is almost always the reason.
Verifying it's working
Run a Codex command or a desktop session, then open the Codex dashboard in Grafana. Within a few minutes you should see non-zero values in Total Conversations, Total Tool Calls, and Total Tokens, and entries in the Codex Event Stream at the bottom.
Docker Compose
Setup
1. Clone the repo:
git clone https://github.com/KB1SLN-Labs/agent-observability.git
cd agent-observability
2. (Optional) Adjust ports:
If any default ports conflict with something already running on your host, copy .env.example to .env and change the values you need:
# macOS / Linux
cp .env.example .env

# Windows
copy .env.example .env
GRAFANA_PORT=3000
OTLP_GRPC_PORT=4317
OTLP_HTTP_PORT=4318
PROMETHEUS_PORT=9090   # commonly conflicts — change this if needed
LOKI_PORT=3100
Only set the values you're changing. The defaults apply for anything you leave out.
3. Start the stack:
docker compose up -d
4. Configure Claude Code:
See Configuring Claude Code for full details. The endpoint depends on where the stack is running.
Use the full env block from Configuring Claude Code (the enable switch and per-signal exporters are what actually turn telemetry on). Only OTEL_EXPORTER_OTLP_ENDPOINT changes per deployment:
- Same machine as Claude Code:
"OTEL_EXPORTER_OTLP_ENDPOINT": "http://localhost:4318" - Stack on a remote host:
"OTEL_EXPORTER_OTLP_ENDPOINT": "http://<stack-host>:4318"(the IP/hostname of the Docker machine)
5. Open Grafana:
Navigate to http://localhost:3000 (or http://<stack-host>:3000 if running remotely). Dashboards load automatically — no login required.
Data retention
Prometheus retains 30 days of metrics by default. Loki retains logs until disk pressure triggers cleanup. Both can be adjusted in docker-compose.yml.
Ports
All ports are configurable via .env (see step 1 above for defaults). Only two ports need to be reachable from outside the Docker host: Grafana (for the browser UI) and the OTLP HTTP port (for Claude Code). Prometheus and Loki communicate internally and only matter if you want to query them directly.
Stopping
docker compose down
To remove all stored data:
docker compose down -v
Kubernetes
Manifests are in the k8s/ directory and use Kustomize, which is built into kubectl since v1.14 — no separate install needed.
Setup
1. Clone the repo:
git clone https://github.com/KB1SLN-Labs/agent-observability.git
cd agent-observability
2. Deploy to your cluster:
kubectl apply -k k8s/
This creates the claude-code-observability namespace and deploys all five services. PersistentVolumeClaims are created using your cluster's default StorageClass. If your cluster doesn't have a default StorageClass configured (common on bare metal), you'll need to add a storageClassName to the PVC specs in k8s/prometheus.yaml, k8s/loki.yaml, and k8s/tempo.yaml before deploying, or use the Helm chart where this is a simple values option.
Grafana and the OTel Collector use LoadBalancer services by default. If your cluster doesn't have a load balancer provisioner (bare metal, local clusters, etc.), change type: LoadBalancer to type: NodePort in k8s/otel-collector.yaml and k8s/grafana.yaml before running kubectl apply.
3. Wait for external IPs to be assigned:
kubectl get svc -n claude-code-observability --watch
Wait until both otel-collector and grafana show an EXTERNAL-IP. If you switched to NodePort, the assigned ports will appear under PORT(S).
4. Configure Claude Code:
See Configuring Claude Code for the full env block. Set OTEL_EXPORTER_OTLP_ENDPOINT to the collector's external IP: "http://<otel-collector-external-ip>:4318".
5. Open Grafana:
Navigate to http://<grafana-external-ip>:3000. Dashboards load automatically — no login required.
Data retention
Prometheus, Loki, and Tempo each get a 10Gi PersistentVolumeClaim by default. Prometheus is configured to retain 30 days of metrics; Tempo retains 7 days of traces. Adjust PVC sizes in k8s/prometheus.yaml, k8s/loki.yaml, and k8s/tempo.yaml before first deploy.
Tearing down
kubectl delete -k k8s/
This removes all workloads and services but leaves the PersistentVolumeClaims intact so data survives accidental teardowns. To remove everything including stored data:
kubectl delete -k k8s/
kubectl delete pvc -n claude-code-observability --all
Helm
The Helm chart is in the helm/ directory. It deploys the same five-service stack as the Kubernetes manifests but all tunables — image versions, service types, PVC sizes, retention, resource limits — are in values.yaml rather than requiring direct manifest edits.
Setup
1. Clone the repo:
git clone https://github.com/KB1SLN-Labs/agent-observability.git
cd agent-observability
2. Install the chart:
helm upgrade --install claude-code ./helm --namespace claude-code-observability --create-namespace
upgrade --install is safe to run multiple times — it installs on first run and upgrades on subsequent runs. Use it for both fresh installs and updates.
To override defaults — for example, to use a specific StorageClass or switch to NodePort:
helm upgrade --install claude-code ./helm \
  --namespace claude-code-observability \
  --create-namespace \
  --set prometheus.persistence.storageClass=standard \
  --set otelCollector.service.type=NodePort \
  --set grafana.service.type=NodePort
3. Wait for external IPs to be assigned:
kubectl get svc -n claude-code-observability --watch
Wait until claude-code-otel-collector and claude-code-grafana show an EXTERNAL-IP. If you switched to NodePort, the assigned ports will appear under PORT(S).
4. Configure Claude Code:
See Configuring Claude Code for the full env block. Set OTEL_EXPORTER_OTLP_ENDPOINT to the collector's external IP: "http://<otel-collector-external-ip>:4318".
5. Open Grafana:
Navigate to http://<grafana-external-ip>:3000. Dashboards load automatically — no login required.
Customization
All values are in helm/values.yaml. The most commonly changed ones:
| Value | Default | Description |
|---|---|---|
prometheus.retention | 30d | How long Prometheus keeps metrics |
prometheus.persistence.size | 10Gi | Prometheus PVC size |
loki.persistence.size | 10Gi | Loki PVC size |
tempo.retention | 168h | How long Tempo keeps traces (7 days) |
tempo.persistence.size | 10Gi | Tempo PVC size |
prometheus.persistence.storageClass | "" | StorageClass for Prometheus PVC (cluster default if empty) |
loki.persistence.storageClass | "" | StorageClass for Loki PVC (cluster default if empty) |
tempo.persistence.storageClass | "" | StorageClass for Tempo PVC (cluster default if empty) |
otelCollector.service.type | LoadBalancer | LoadBalancer or NodePort |
grafana.service.type | LoadBalancer | LoadBalancer or NodePort |
otelCollector.service.annotations | {} | Annotations passed to the load balancer service — use this to select a specific load balancer class or configure cloud-specific behavior (e.g. AWS NLB, GCP internal) |
grafana.service.annotations | {} | Same, for the Grafana service |
Upgrading
helm upgrade --install claude-code ./helm --namespace claude-code-observability
Upgrades do not affect existing PersistentVolumeClaims or stored data.
Tearing down
helm uninstall claude-code --namespace claude-code-observability
This removes all workloads and services but leaves the PersistentVolumeClaims intact. To remove everything including stored data:
helm uninstall claude-code --namespace claude-code-observability
kubectl delete pvc -n claude-code-observability --all
Upgrading an existing deployment
If you already have the stack running from an earlier version, this section gets the latest onto your running install. No data is lost — Prometheus, Loki, and Tempo retain their existing data across the upgrade.
Recent versions changed more than dashboards — there is now a new Tempo service (the traces backend) plus collector and Grafana datasource changes — so an upgrade is a full re-apply, not just a dashboard swap. The safe path is the same git pull + redeploy your method already uses, which creates the Tempo service and updates the collector/Grafana config.
1. Pull the latest repo in all cases:
cd agent-observability
git pull
Then follow the steps for your deployment method.
Docker Compose
up -d creates the new Tempo service and applies the updated collector and Grafana config. Dashboards reload automatically (~30s). The --force-recreate ensures the collector and Grafana pick up their config changes:
docker compose up -d --force-recreate
If you don't see the new panels after a minute, hard-refresh the browser (Grafana caches dashboards client-side).
Kubernetes (Kustomize)
Re-apply to create the Tempo service and update the dashboard/collector/datasource ConfigMaps, then restart the collector and Grafana so they load their new config:
kubectl apply -k k8s/
kubectl rollout restart deployment otel-collector grafana -n claude-code-observability
Note: a pod that has been running since before its ConfigMap changed will not always hot-reload it reliably. The
rollout restartguarantees the collector and Grafana load the new config. PersistentVolumeClaims (metrics / logs / traces) are not affected by the restart.
Helm
helm upgrade --install claude-code ./helm --namespace claude-code-observability
kubectl rollout restart deployment claude-code-otel-collector claude-code-grafana -n claude-code-observability
upgrade --install deploys the Tempo service and re-renders the collector, datasource, and dashboard ConfigMaps. The rollout restart ensures the running pods load the updated config. PVCs and stored data are preserved.
Verifying the upgrade
- Both agent dashboards exist: Claude Code (+ Logs) and Codex (+ Logs), cross-linked via the header links.
- Grafana has three datasources: Prometheus, Loki, and Tempo (Connections → Data sources).
- The Claude Code dashboard shows five sections under a banner explaining the API-equivalent cost figures.
- Traces are arriving: open Explore → Tempo and search — once an agent has run, you should see traces. (If empty, confirm the agent's trace exporter points at the collector and the collector/Grafana pods were restarted.)
What changed (recent versions)
- Renamed the project from
claude-code-observabilitytoagent-observability— it now monitors more than Claude Code. (GitHub auto-redirects the old repo URL; update yourgit remotewhen convenient.) - Added a Codex dashboard (and Codex — Logs) for OpenAI Codex, covering both the CLI and the desktop app: sessions, tokens, latency, tools, decisions, MCP attribution, and code-activity proxies. Structured to mirror the Claude Code dashboard for easy switching.
- Added Tempo as the traces backend — completing the metrics + logs + traces pipeline. Both agents emit all three OTel signals; the collector now routes traces to Tempo (which also derives latency span metrics into Prometheus). Tempo ships in all three deployment paths.
- Codex trace-latency panels — operation-level p95/avg latency, call rate, and end-to-end turn duration, derived from trace span metrics.
- Cost panels relabeled "API-equivalent" with a banner, so the dollar figures (estimated API list prices, not your actual subscription bill) aren't mistaken for money owed.
- Honest token-volume panels replaced an earlier broken "% of plan limit" gauge (OTel can't reconstruct the quota reset — use
/usagein the CLI for true remaining quota). - More attribution and output panels — cost/tokens by skill, MCP server, and effort level; commits, response latency p95, and request/transport errors.
- Reorganized the Claude Code dashboard into five labeled sections; every panel now respects the time picker (a couple of intentional fixed-window panels aside).
- Configuration changes for traces: to capture traces, point each agent's trace exporter at the collector. For Codex, add the metrics/traces exporters to
config.toml(see Configuring Codex). For Claude Code, addOTEL_TRACES_EXPORTER=otlpand theCLAUDE_CODE_ENHANCED_TELEMETRY_BETA=1beta flag (see Configuring Claude Code). Metrics and logs for both agents are unaffected.
Troubleshooting
Panels show no data after setup
- Confirm the
OTEL_EXPORTER_OTLP_ENDPOINTinsettings.jsonmatches the host and port the OTel Collector is actually listening on. - Check that port 4318 is reachable from the Claude Code machine to the collector host — firewalls are a common cause.
- Make sure Claude Code was fully restarted after saving
settings.json, not just opened in a new terminal tab within an existing session. - Confirm the OTel Collector container or pod is running and healthy (
docker compose psorkubectl get pods -n claude-code-observability).
Metrics appear but log-sourced panels are empty
Log-sourced panels include Tool Usage Breakdown, Tool Decision Sources, Prompts Per Hour, Prompt Length Distribution, Response Latency p95 by Model, and Request Errors. If these show no data while cost and token panels are working, the log pipeline specifically isn't reaching Loki. Check:
- The Loki container or pod is running and healthy.
- The OTel Collector logs don't show errors exporting to Loki (
docker compose logs otel-collectororkubectl logs -n claude-code-observability deployment/loki). - The Logs dashboard shows entries in the Log Stream panel — if it does, the data is in Loki and the issue is likely a query or time range mismatch on the affected panels.
Trace panels or the Tempo explorer are empty
Traces are off by default and need explicit enabling. Confirm the agent's trace exporter is configured (OTEL_TRACES_EXPORTER=otlp + CLAUDE_CODE_ENHANCED_TELEMETRY_BETA=1 for Claude Code; the [otel.trace_exporter.otlp-http] block for Codex) and that the agent was fully restarted afterward. Then check the collector is forwarding to Tempo (it logs no otlp/tempo export errors) and that Tempo's pod/container is healthy. The trace-derived p95 panels also need a few turns within their window before a percentile can be computed — they read empty during idle.
Grafana shows "No data" on a specific panel
Expand the time range. Some panels (especially 7-day averages and anomaly detection) need at least a few days of data to produce meaningful output. The picker defaults to the last 24 hours — widen it for more history, but if the stack was just installed, the 7-day-average and anomaly panels won't have enough data yet regardless.
Dashboard reference
Four dashboards ship with the stack: Claude Code (main) and Claude Code — Logs, plus Codex (main) and Codex — Logs. They're cross-linked via header links so you can jump between them.
Claude Code (main)
Panels respect the dashboard time picker (default: last 24 hours) — stat, gauge, pie, and bar panels show data for the selected range, so widening the picker to 7 or 30 days widens what they report. A handful of panels keep an intentional fixed window (Real-Time Burn Rate is a 30-minute trailing rate, Cost Forecast extrapolates a 6-hour rate, Weekly Total Token Usage is a fixed 7 days, and the "vs 7-day average" baselines on stat panels are always a rolling 7-day comparison). The dashboard refreshes every 5 minutes. Most stat panels show the current value alongside that 7-day rolling average, and sparkline panels add a percentage-change indicator vs the prior equivalent window.
The dashboard is organized into five collapsible sections: Cost (API-Equivalent), Tokens & Usage, Productivity & Output, Tools, MCP & Skills, and Performance. A banner at the top restates that all dollar figures are API-equivalent estimates, not actual charges.
💵 Cost — API-Equivalent (NOT your actual bill)
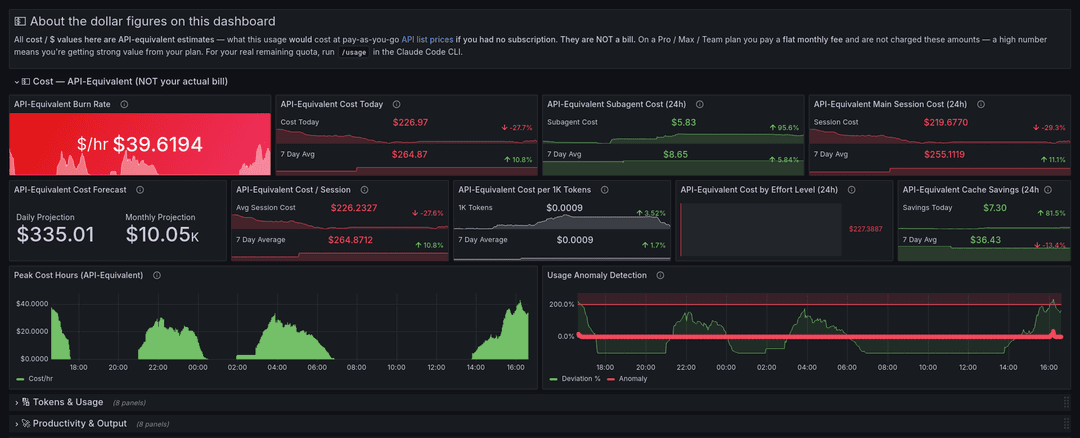
Every panel in this section is denominated in API-equivalent cost — what your usage would cost at pay-as-you-go API list prices if you had no subscription. On a Pro/Max/Team plan you are not charged these amounts (see the note on cost figures above). They remain useful as a measure of usage intensity and of the value you're getting from a flat-fee plan.
API-Equivalent Burn Rate
Current usage rate in API-equivalent dollars per hour, calculated from a 30-minute trailing window. The window is intentionally wide — Claude Code emits metrics per request rather than continuously, so a shorter window zeros out between turns. Background turns green below $0.50/hr, yellow up to $2.00/hr, red above.
API-Equivalent Cost
API-equivalent cost over the selected time range alongside the 7-day rolling daily-average baseline. The percentage change compares the current window to the prior equivalent one. If the current value is well above your 7-day average and trending up, check whether a session is accumulating more context than usual.
API-Equivalent Subagent Cost
API-equivalent cost attributed to spawned subagent tasks — parallel research, background code review, multi-agent work. Compare against Main Session Cost to understand what fraction of your usage is autonomous parallel work versus direct conversation. Includes the 7-day average and today-vs-yesterday change.
API-Equivalent Main Session Cost
API-equivalent cost from primary conversation turns: your prompts and Claude's direct responses. Excludes subagent and auxiliary tasks. Includes the 7-day average and percentage change.
API-Equivalent Cost Forecast
Daily and monthly projections of API-equivalent cost extrapolated from the current 6-hour burn rate. The 6-hour window smooths out short spikes — what you see reflects sustained activity. On a subscription plan a high projection is a value signal, not an upcoming bill.
API-Equivalent Cost / Session
Average API-equivalent cost per session over the selected time range compared to the 7-day average. A rising number over multiple days usually means sessions are running longer without being compacted — context accumulates and each turn costs more to process.
API-Equivalent Cost per 1K Tokens
Effective API-equivalent cost per 1,000 tokens across all token types. Cache reads cost roughly 10% of input price, so a well-cached workflow will push this number well below the model's headline rate. Includes the 7-day average and percentage change. Rising cost-per-token despite stable usage typically means cache efficiency has dropped.
API-Equivalent Cost by Effort Level
API-equivalent cost grouped by the effort setting (low / medium / high / max) over the selected time range. Effort controls the model's thinking-token budget. A large share at high or max effort is worth checking against whether those tasks actually needed deep reasoning.
API-Equivalent Cache Savings
Estimated API-equivalent dollars saved by prompt caching over the selected time range, versus the 7-day average. Computed as cacheRead tokens × the input-vs-cache price difference (Sonnet $2.70/1M, Haiku $0.72/1M). On a subscription plan this is an efficiency/value figure, not cash back.
Peak Cost Hours (API-Equivalent)
API-equivalent cost per hour as a bar chart. Spikes show which hours were most usage-intensive — cross-reference with sessions you remember running during those periods.
Usage Anomaly Detection
Hourly usage (measured via API-equivalent cost) expressed as percentage deviation from the 7-day historical average for the same hour. A value of 0% means today matches the historical average; 200% means it's three times higher. Excursions above 200% are flagged in red — investigate what was running during those periods. This is a relative usage signal, not a dollar amount owed.
🔢 Tokens & Usage
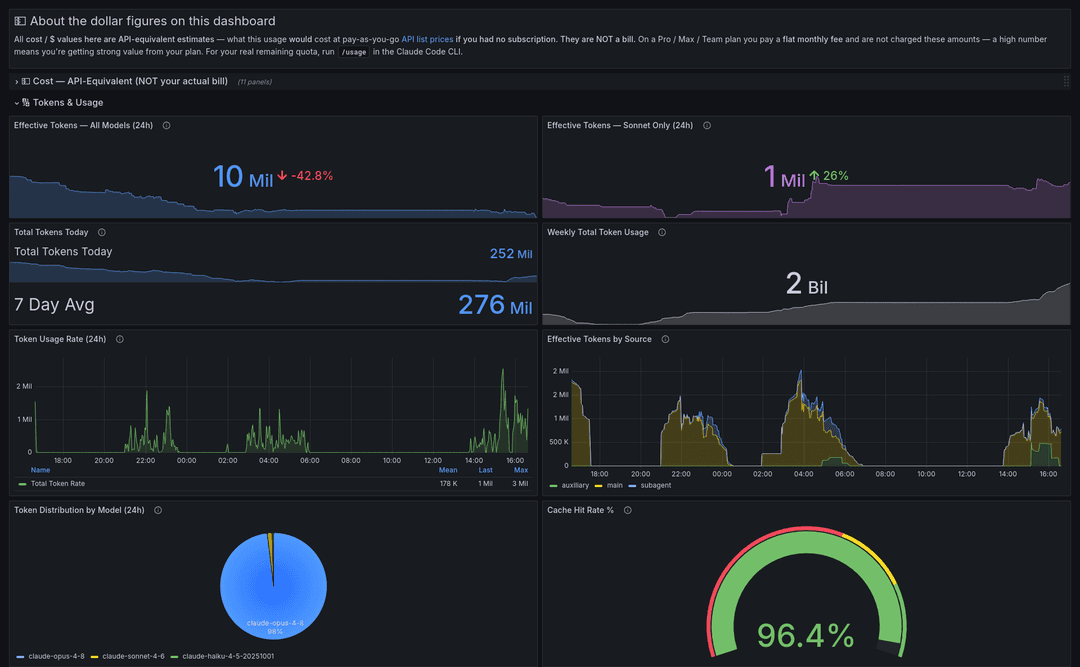
Effective Tokens — All Models
Actual effective (non-cacheRead) tokens consumed across all models over the selected time range, with a 7-day sparkline trend. These are the tokens that count toward Anthropic's usage limits — cacheRead tokens are excluded because they don't count the same way. This is a real measured volume, not a percentage of any limit: OTel telemetry can't reconstruct your quota gauge because the weekly reset boundary isn't exported. For true remaining quota, run /usage in the Claude Code CLI.
Effective Tokens — Sonnet Only
The same effective-token measure scoped to Sonnet, which has its own separate usage cap at Anthropic. A 7-day sparkline shows the trend.
Total Tokens
All tokens consumed over the selected time range across all types, alongside the 7-day daily average.
Weekly Total Token Usage
Total tokens consumed over the last 7 days with a sparkline showing the daily trend. A consistently rising slope means usage is accelerating.
Token Usage Rate (24h)
Total tokens consumed per minute. The legend table shows mean, last, and peak rates for the selected window. Use this to gauge proximity to your plan's TPM rate limit — if the rate is approaching your ceiling, starting a fresh session or running /compact is the right move.
Effective Tokens by Source
Hourly effective (non-cacheRead) tokens stacked by query source: main (direct conversation turns), auxiliary (background context builds), and subagent (parallel spawned agents). A rising subagent share means Claude is doing more autonomous orchestration relative to interactive work.
Token Distribution by Model
Pie chart showing the share of total tokens consumed by each model. Sonnet dominating is expected for most workloads. A large Opus slice is worth checking — Opus costs roughly 5x Sonnet per token, and many tasks don't require it.
Cache Hit Rate %
Percentage of input-side tokens served from Anthropic's prompt cache. Above 80% is healthy. Below 60% suggests sessions may be too short to warm the cache effectively, or context structure is preventing cache blocks from being reused. Gauge arc turns red below 60%, yellow up to 80%, green above.
🚀 Productivity & Output
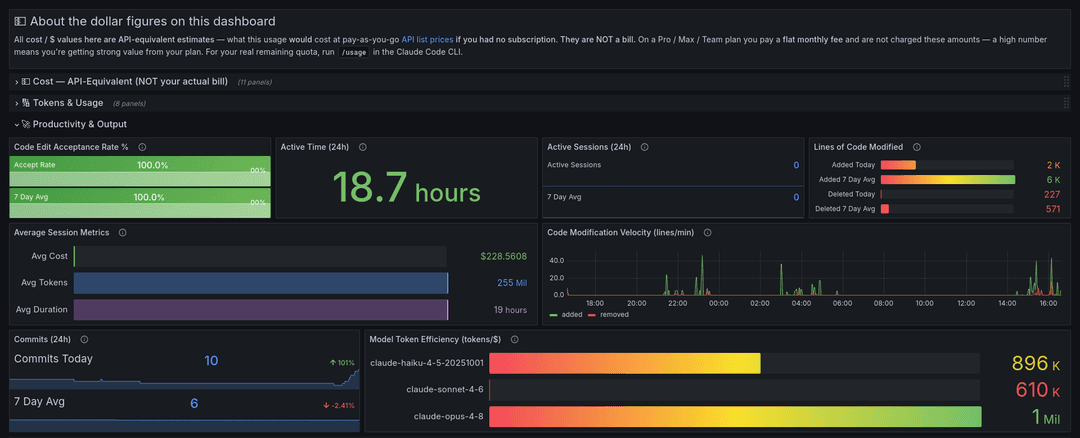
Code Edit Acceptance Rate %
Percentage of Claude's proposed file edits that were accepted over the selected time range, plus the 7-day average. Below 80% is worth investigating — the most common causes are context drift mid-session, an ambiguous task description, or Claude losing track of the codebase structure. Background turns red below 60%, yellow up to 80%, green above. Shows "No edits" if no edit activity occurred in the window.
Active Time
Two values side by side: CLI time (how long Claude Code was running and processing) and User time (how long you were actively engaged — typing, reviewing). A high CLI-to-user ratio means Claude is doing a lot of autonomous work between your interactions.
Active Sessions
Number of Claude Code sessions started over the selected time range, alongside the 7-day daily average and prior-window change.
Lines of Code Modified
Lines added and deleted today alongside 7-day rolling daily averages for each. A large gap between today and the 7-day average indicates an unusually active or unusually quiet day.
Average Session Metrics
Three horizontal bars showing per-session averages across the selected time range: API-equivalent cost ($), total token count, and active CLI time. Rising values across multiple days point to sessions accumulating context without being reset. A useful complement to API-Equivalent Cost / Session — if cost is rising but token count is flat, a more expensive model is being used more often.
Code Modification Velocity (lines/min)
Lines added and removed per minute as a timeseries. Green is additions, red is removals. Spikes indicate concentrated editing bursts. A sustained high removal rate relative to additions typically means refactoring or large-scale cleanup.
Commits
Git commits made via Claude Code over the selected time range, compared to the 7-day daily average. Pairs with the lines-of-code panels to show shipped output, not just edit volume.
Model Token Efficiency (tokens/$)
Total tokens per API-equivalent dollar, broken down by model, over the selected time range. Higher is more efficient. Haiku should significantly outperform Opus given the price difference. If the gap is narrower than expected, check whether model selection is being overridden somewhere.
🛠️ Tools, MCP & Skills
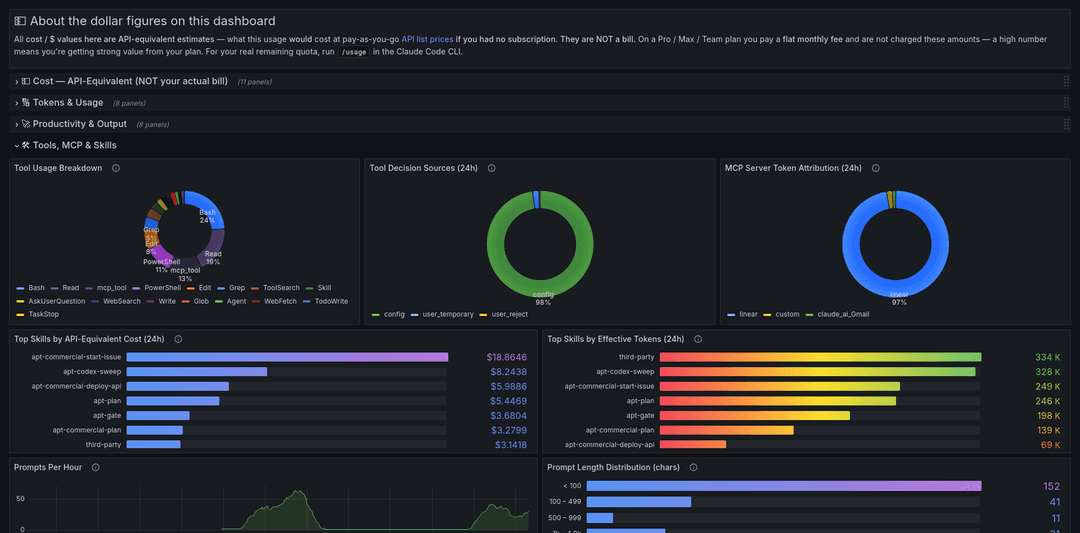
Tool Usage Breakdown
Donut chart of tool calls by type over the selected time range, sourced from structured logs. Covers all tools: Bash, Read, Edit, Write, Glob, Grep, and others. Heavy Bash usage points to shell-and-test work; heavy Edit/Write usage is more code generation.
Tool Decision Sources
Donut chart showing how tool executions were authorized: via CLAUDE.md or settings (config), approved once for the session (user temporary), or added to the permanent allow list (user permanent). A high user temporary fraction means you're approving many tools interactively that could be moved to config.
MCP Server Token Attribution
Donut chart of token consumption attributed to MCP server calls over the selected time range. Only turns that invoked an MCP tool carry the server-name label, so this shows which MCP integrations are driving context size. User-configured (non-registry) servers appear as custom.
Top Skills by API-Equivalent Cost
Horizontal bars ranking named skills by the API-equivalent cost of the turns where they were active, over the selected time range. Turns without an active skill are excluded. High-cost skills often have large context windows or expensive prompt templates worth reviewing. (Third-party plugin skill names are redacted to third-party by Claude Code.)
Top Skills by Effective Tokens
The same skill ranking by effective (non-cacheRead) token volume. A skill high in tokens here but low in the cost panel is getting strong cache reuse; a skill high in both is a genuine cost driver.
Prompts Per Hour
Count of user prompt events over a rolling 1-hour window, sourced from structured logs. Peaks show concentrated interaction periods; flat sections are idle time.
Prompt Length Distribution (chars)
Character count distribution across five buckets: under 100, 100–499, 500–999, 1k–4.9k, and 5k+, sourced from structured logs. Most prompts are short. Long prompts (1k+) usually indicate pasted code, error output, or a detailed task description. A spike in the 5k+ bucket during a session that went expensive is often the explanation.
⚡ Performance

Response Latency p95 by Model
95th percentile response time per request, broken down by model, over the selected range — sourced from structured request logs. This is how long Anthropic's servers take to respond, a real performance signal for everyone regardless of plan or billing. Higher Sonnet latency vs Haiku reflects longer reasoning chains; sustained spikes above baseline signal context-window pressure or server backpressure. Bars turn yellow at 30s, red at 60s.
Request Errors
Count of failed requests over the selected time range — rate-limit rejections, network errors, and model errors returned by Anthropic's servers. Applies to all users regardless of plan. Green at zero; any errors turn the panel yellow, 5+ turns it red. Drill into the Logs dashboard for detail.
Claude Code — Logs
A dedicated log explorer linked from the main dashboard. Filter by severity level and optionally paste a session ID to scope to a single session.
Errors / Warnings / Total Entries / Active Sessions
Stat tiles showing counts for the selected time range. Scan these first to gauge whether a period had unusual error rates before opening the full log stream.
Log Volume Over Time
Error, warning, and total log entry counts per minute as a timeseries. Error and warning spikes here are the signal to scroll down and investigate.
Log Stream
Full filterable log stream. Set the Level variable to narrow by severity. Paste a session ID in the Session ID field to isolate a single session. Click any row to expand the full structured payload.
Codex
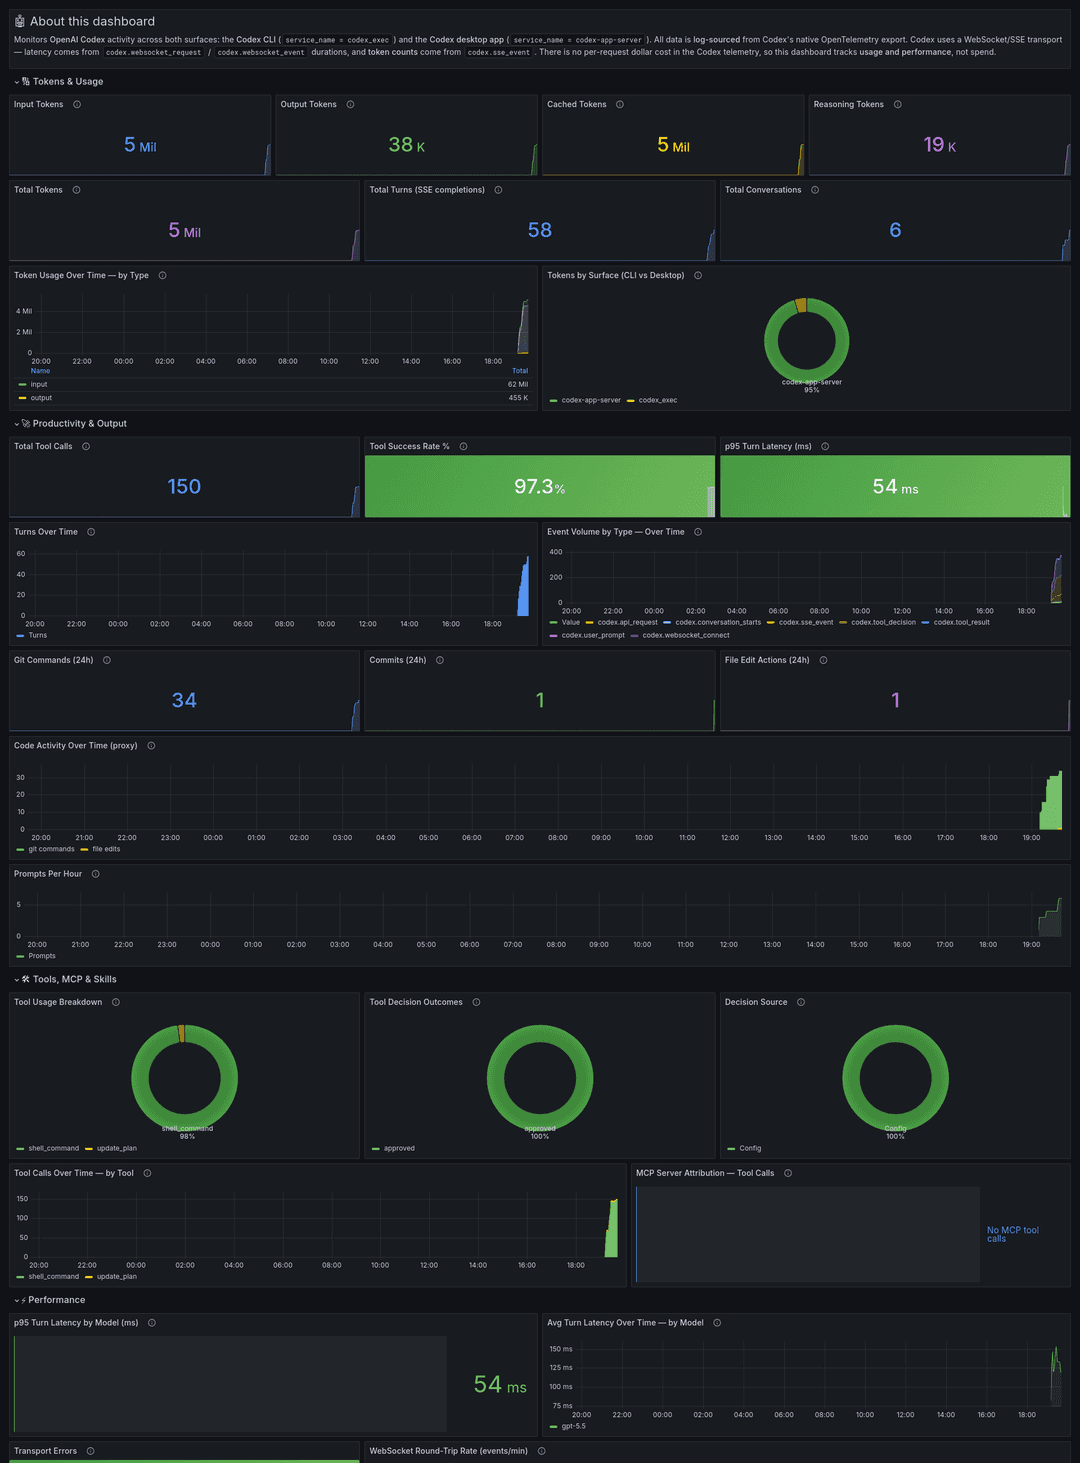
Monitors OpenAI Codex across both surfaces — the Codex CLI (service_name = codex_exec) and the Codex desktop app (service_name = codex-app-server). Every panel is log-sourced from Codex's OpenTelemetry export. Codex uses a WebSocket/SSE transport, so latency comes from WebSocket round-trip durations and token counts come from SSE completion events. There is no per-request dollar cost in Codex's telemetry, so this dashboard tracks usage and performance, not spend.
The section structure deliberately mirrors the Claude Code dashboard — Tokens & Usage, Productivity & Output, Tools/MCP/Skills, and Performance appear in the same order with the same names — so you can move between the two dashboards without re-orienting. Codex adds two of its own sections (Sessions & Conversations, Live Event Feed) for data Claude Code doesn't expose. Where Claude Code has a Cost section, Codex has none — its telemetry carries no cost figures.
Most Codex panels are log-sourced (from codex.* events); the latency-breakdown panels in the Performance section are trace-sourced (from Tempo span metrics in Prometheus). Panel names below match the dashboard.
🔢 Tokens & Usage
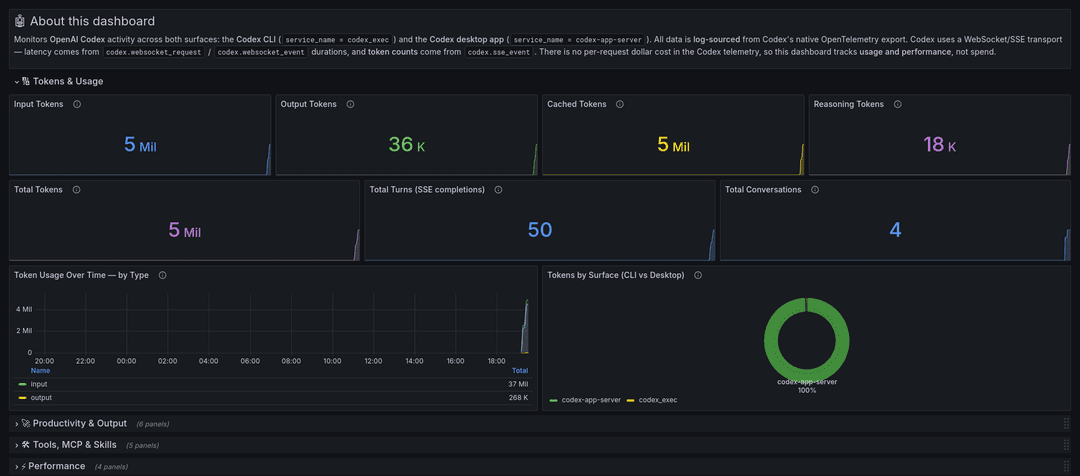
Token counts come from codex.sse_event completion events.
Input Tokens
Total input (prompt) tokens across all turns in the selected range.
Output Tokens
Total output (generated) tokens across all turns.
Cached Tokens
Total cached input tokens reused across turns (cached_token_count). A higher cached share means cheaper, faster prompts.
Reasoning Tokens
Total reasoning tokens consumed (reasoning_token_count) — the model's internal thinking budget.
Total Tokens
Sum of input + output tokens across all turns. Cached and reasoning tokens are shown separately above.
Total Turns (SSE completions)
Count of completed model responses (sse_event with event.kind = response.completed) — a proxy for total request turns.
Total Conversations
Distinct Codex conversations started in the range (codex.conversation_starts), across CLI and desktop.
Token Usage Over Time — by Type
Hourly input, output, cached, and reasoning token totals. Watch for rising input/cached over a long session (context growth).
Tokens by Surface (CLI vs Desktop)
Share of output tokens generated by the Codex CLI (codex_exec) versus the desktop app (codex-app-server).
🚀 Productivity & Output
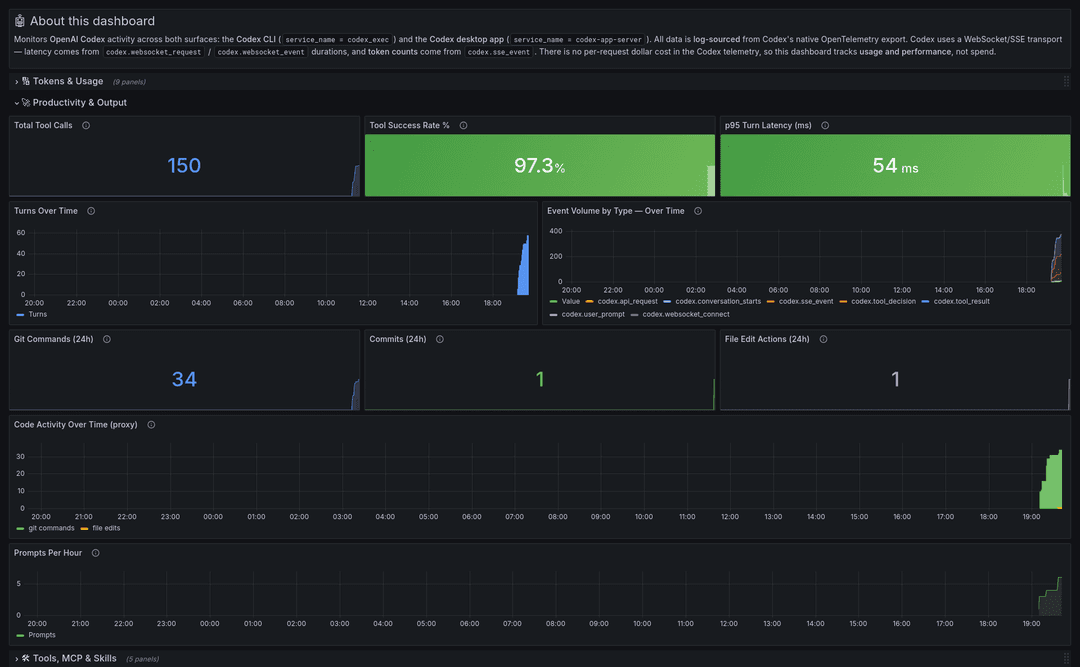
Total Tool Calls
Count of tool executions (codex.tool_result) across both surfaces.
Tool Success Rate %
Percentage of tool_result events with success="true". Below 70% red, 70–85% yellow, above 85% green.
p95 Turn Latency (ms)
95th percentile WebSocket round-trip duration (websocket_event duration_ms) — the closest available signal to model response time. Green < 5s, yellow < 15s, red ≥ 15s.
Turns Over Time
Completed model responses (sse_event response.completed) per hour — a proxy for request volume.
Event Volume by Type — Over Time
Codex event counts per hour by event type, excluding the high-volume websocket_event noise. Shows the rhythm of conversations, prompts, tool calls, and completions.
Git Commands / Commits / File Edit Actions (code-activity proxies)
Claude Code emits native git telemetry; Codex emits none — no lines-of-code, commit, or diff fields. These three derive proxies from Codex's shell command stream (the arguments on codex.tool_result): Git Commands counts shell calls containing git , Commits counts git commit invocations, and File Edit Actions counts file-writing commands (Set-Content / Out-File / apply_patch / Add-Content). They are command-derived counts, not true line counts — treat them as activity indicators, not exact figures.
Code Activity Over Time (proxy)
Hourly count of git commands and file-edit actions from the shell command stream. Compare its shape to Claude Code's Code Modification Velocity.
Prompts Per Hour
User prompts submitted per hour (codex.user_prompt). Peaks show concentrated interaction.
🛠️ Tools, MCP & Skills

Tool Usage Breakdown
Share of tool calls by tool name (codex.tool_result). shell_command dominating is typical for coding work.
Tool Decision Outcomes
How tool executions were authorized (codex.tool_decision): approved / denied / ask. A high denied/ask share means Codex is hitting approval friction.
Decision Source
What authorized each tool decision (source): Config (approval policy) vs interactive user approval.
Tool Calls Over Time — by Tool
Tool call volume per hour, split by tool name. Bursts of shell_command track active build/test cycles.
MCP Server Attribution — Tool Calls
Tool calls attributed to an MCP server (mcp_server, non-empty). Built-in tools (shell, file) have no mcp_server and are excluded.
Most Used Tools
Per-tool table over the selected range: uses, average duration, and success rate — joined on tool_name.
// faq
What is agent-observability?
Self-hosted OpenTelemetry observability stack for AI coding agents (Claude Code + OpenAI Codex). All telemetry stays local — OTel Collector → Prometheus + Loki → Grafana.. It is open-source on GitHub.
Is agent-observability free to use?
agent-observability is open-source, so it is free to use.
What category does agent-observability belong to?
agent-observability is listed under automation in the Claudeers registry of Claude-compatible tools.
// embed badge

[](https://claudeers.com/agent-observability)
// retro hit counter

[](https://claudeers.com/agent-observability)
// reviews
// guestbook
// related in MCP Servers
 🔓
🔓f.k.a. Awesome ChatGPT Prompts. Share, discover, and collect prompts from the community. Free and open source — self-host for your organization with complete…
 🔓
🔓A cross-platform desktop All-in-One assistant for Claude Code, Codex, OpenCode, OpenClaw, Gemini CLI & Hermes Agent. Only official website: ccswitch.io
 🔓
🔓🪨 why use many token when few token do trick — Claude Code skill that cuts 65% of tokens by talking like caveman
 🔓
🔓An open-source AI agent that brings the power of Gemini directly into your terminal.