
agent-monitor-for-claude
Local Windows desktop monitor for your running Claude Code agents - live status, estimated cost, model, host and one-click focus, grouped by project. Read-on…
Install with your AI
Paste into Claude Code, Cursor, or any agent — it reads the repo and wires the tool into your project.
Install and set up agent-monitor-for-claude (release-binary project) into my current project.
Found on https://claudeers.com/agent-monitor-for-claude
Repo: https://github.com/jens-duttke/agent-monitor-for-claude
Homepage/docs: —
Detected install method: release-binary → inspect the README
Category: automation. Platforms: cli, api, desktop, web.
Read the repo's README for exact setup and env vars, then install it and wire it into my project.

Claudeers Health Verdict:
active; community-verified: false. Confirm the source before running anything.
Grab the latest release asset from GitHub.
# download a build from https://github.com/jens-duttke/agent-monitor-for-claude/releases
git clone https://github.com/jens-duttke/agent-monitor-for-claude
// compatibility
| Platforms | cli, api, desktop, web |
|---|---|
| Operating systems | — |
| AI compatibility | claude |
| License | MIT |
| Pricing | open-source |
| Language | Python |
Agent Monitor for Claude
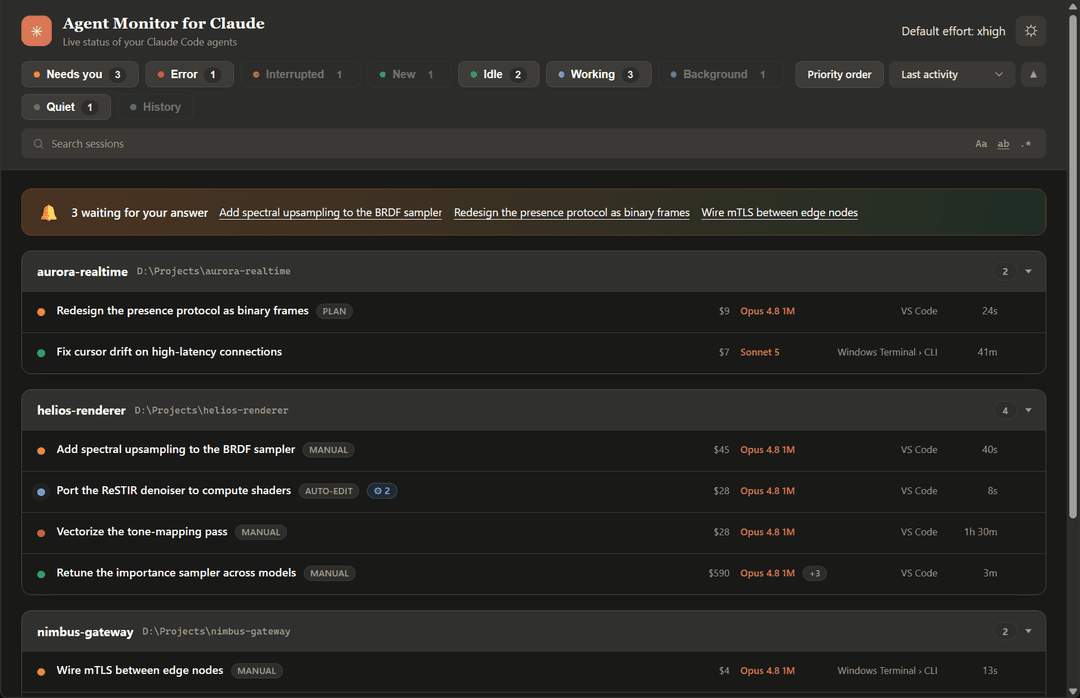
A local desktop window that shows every running Claude Code agent at a glance - grouped by project, with each agent's live status: working, waiting for you, blocked on a permission prompt, or finished.
If you run many Claude Code agents across several projects, you cannot tell from the IDE which one is actually doing something and which is quietly waiting for you. Agent Monitor answers that in one glance.
[!IMPORTANT] This project is still in an early stage. Detailed issue reports - with steps to reproduce, what you expected, and what actually happened - are very welcome and help a lot.
Features
It just works
- Portable - a single Windows executable, no installation.
- Zero configuration - it finds your Claude config directory automatically (honors
CLAUDE_CONFIG_DIR).
What you see every day
- Live agent overview - every running Claude Code agent, grouped by the project it belongs to, refreshed every few seconds.
- WSL sessions too - Claude Code agents running inside WSL distributions appear alongside your Windows agents, read over
\\wsl.localhostwith nothing ever executed inside the distro; the distro shows as the session's host, and its background processes and task output are visible in the same panel as any other agent's (see below). - Know who needs you - a banner lists the agents blocked on a question, plan review, or permission prompt, with a one-click jump to each, so you never leave one hanging.
- Status at a glance - each agent shows working, waiting for you, permission needed, interrupted (you stopped it mid-turn), error (the turn hit a usage/session limit or other API error and cannot continue), or finished, with the time since its last activity.
- Filter and sort to what matters - the status chips (needs you, error, interrupted, new, idle, working, background, quiet, attention-first order) start all on, and you uncheck the ones you want to hide; each chip's colored dot doubles as the key to what the row dots mean, and hovering a chip explains what that status means and when it occurs; sort by activity, usage, model, host, or status. Your filter and sort choices are remembered across restarts.
- Search session content - a search box narrows the view to the sessions whose transcript contains what you type. As in your editor, three toggles refine it: match case, match whole word, and use a regular expression (an invalid pattern turns the box red); your choices are remembered. It searches only the sessions the active filter chips currently show (so it stays fast and covers exactly what you see), newest sessions first, running locally on demand with a progress bar and streaming results in as they are found; the chip counts update to match. Results stay current as your agents work - a running session that newly contains the text shows up on its own. Press Escape to clear it. The search reads transcript text only to answer "does this session contain the string?" - it reports back only which sessions matched, never any of their content, and nothing ever leaves your machine.
- Urgent projects on top - across all projects, the ones blocked on a prompt float above those actively working, which sit above the idle and finished ones; within each band the order stays stable so panels do not jump around on every status change. A toggle turns this off for a plain A-Z layout.
- See where it runs - each agent shows its host application (VS Code, JetBrains IDEs, terminals, and more), with a CLI marker for terminal-driven agents.
- Cost at a glance - each agent shows an estimated dollar cost (computed per model, so cheaper subagent models are priced right), with the full per-tier token breakdown - base input, output, cache read, and 5m/1h cache writes - one half-second hover away. Prices live in an editable
pricing.json(see docs/configuration.md); you can even enter a future price change under its start date and it applies on its own. - Subagents in flight - a badge shows how many subagents an agent is running right now (and how many recently finished), with a hover listing what each is doing. For a background workflow it shows the run's total agent count, with progress in the tooltip (e.g. "Workflow: 8/12 agents"), and the session stays marked busy across the pauses between the workflow's phases instead of flickering back to idle.
- Background processes and task output - a badge shows how many OS processes an agent is running (a watched build, a scan). Click it for a panel with a live per-process table (CPU, memory, and how long each has run, updated every second) and the agent's background tasks; expand a task to watch its live output stream in a mono-space console - with the task's ANSI terminal colors preserved and its text selectable to copy - so you can follow progress and estimate how long it still needs (if the task redirected its output to a file in its own scratchpad or project folder, the panel follows that redirect). Output is read only while you have a task expanded. For a Windows-hosted agent whose tools run through WSL (the Bash tool relaying via
wsl.exe) - a different thing from the "WSL sessions too" bullet above - the panel also shows the shared WSL2 virtual machine's total CPU and memory - where the real load lives, since WSL runs its Linux work inside that VM out of Windows' per-process view. - Jump right to it - click an agent and its hosting window comes to the foreground; for VS Code extension sessions the exact session tab is focused via the extension's official deep link. Click a project's path in its panel header to open that folder in Windows Explorer.
- Revisit and clean up past sessions - a History chip (off by default) lists finished sessions that are no longer running - the ones
claude --resumewould show - grouped under their projects and loaded on demand. From a past session's row menu you can, after a confirmation that names the session it is about to delete, permanently delete its transcript and subagent files from disk. This deletion is the only change the tool ever makes to your Claude Code data - apart from its own interface preferences it writes nothing (see PRIVACY.md), and a running session is never touched.
Reach and preferences
- Light and dark - follows your system theme, with a one-click toggle in the header.
- 13 languages - auto-detected from your system locale (English, German, Spanish, French, Hindi, Indonesian, Italian, Japanese, Korean, Brazilian Portuguese, Ukrainian, Simplified and Traditional Chinese).
- Customizable - an optional settings file tunes the poll interval and window size.
Requirements
- Windows 10 / 11
- Microsoft Edge WebView2 runtime (pre-installed on current Windows)
- Claude Code (this tool reads the session data it writes under
~/.claude/) - WSL sessions need WSL2 with the distro running, plus the
\\wsl.localhostUNC share that Windows 11 (or Windows 10 with the Microsoft Store version of WSL) exposes for it - on an older inbox WSL build without that share, the feature quietly finds nothing; see docs/configuration.md to turn WSL monitoring off - Python 3.10 or newer - only to run or build from source; the prebuilt executable bundles its own Python
Getting started
Prebuilt executable
Download AgentMonitorForClaude.exe from the latest release and run it. No installation.
From source
python -m venv .venv
.venv\Scripts\pip install -r requirements.txt
.venv\Scripts\python -m agent_monitor_for_claude
Configuration
All settings are optional. See docs/configuration.md for the full reference and the settings-file search order.
How it works
Agent Monitor reads the session registry and transcript metadata that Claude Code writes locally, and derives each agent's state from the last assistant turn's stop reason plus process liveness. See docs/how-it-works.md for the details.
Privacy
No outbound network connections, no credentials, no telemetry - and nothing written to disk but its own files, in three places: your interface preferences, a session deletion you explicitly confirm, and the program bundle it unpacks at startup. PRIVACY.md states exactly what is read, what is kept, what is shown, and what is written, and lists the commands and tests to verify each claim yourself.
Building
Building the standalone executable additionally needs PyInstaller, kept out of the runtime requirements:
.venv\Scripts\pip install -r requirements-dev.txt
.venv\Scripts\python build.py
Produces dist/AgentMonitorForClaude.exe.
Developing
Iterate the UI in a browser, no Python or live session needed: open
agent_monitor_for_claude/ui/index.html?mock (or the file directly via file://).
It renders the showcase data from ui/dev-mock.js - a dev-only file that never
ships in the built executable.
License
MIT (c) Jens Duttke
// faq
What is agent-monitor-for-claude?
Local Windows desktop monitor for your running Claude Code agents - live status, estimated cost, model, host and one-click focus, grouped by project. Read-only and fully offline.. It is open-source on GitHub.
Is agent-monitor-for-claude free to use?
agent-monitor-for-claude is open-source under the MIT license, so it is free to use.
What category does agent-monitor-for-claude belong to?
agent-monitor-for-claude is listed under automation in the Claudeers registry of Claude-compatible tools.
// embed badge

[](https://claudeers.com/agent-monitor-for-claude)
// retro hit counter

[](https://claudeers.com/agent-monitor-for-claude)
// reviews
// guestbook
// related in Automation & Workflows
 🔓
🔓 🔓
🔓The API to search, scrape, and interact with the web at scale. 🔥
 🔓
🔓🌐 Make websites accessible for AI agents. Automate tasks online with ease.
 🔓
🔓Taste-Skill - gives your AI good taste. stops the AI from generating boring, generic slop