
agent-console
Local observability for Claude Code and Codex. Sessions, subagents, tokens, model costs, and delivery evidence in one console.
Install with your AI
Paste into Claude Code, Cursor, or any agent — it reads the repo and wires the tool into your project.
Install and set up agent-console (git-clone project) into my current project.
Found on https://claudeers.com/agent-console
Repo: https://github.com/SamSnead85/agent-console
Homepage/docs: https://github.com/SamSnead85/agent-console#readme
Detected install method: git-clone → git clone https://github.com/SamSnead85/agent-console
Category: devtools. Platforms: cli, api, desktop, web, mobile.
Read the repo's README for exact setup and env vars, then install it and wire it into my project.

Claudeers Health Verdict:
unknown; community-verified: false. Confirm the source before running anything.
git clone https://github.com/SamSnead85/agent-console
// compatibility
| Platforms | cli, api, desktop, web, mobile |
|---|---|
| Operating systems | — |
| AI compatibility | claude |
| License | MIT |
| Pricing | open-source |
| Language | JavaScript |

Agent Console
Fleet accounting for Claude Code and Codex.
Every session's tokens, cache reads and writes, models and list-price cost,
on this computer and on every computer you connect, in one local console.
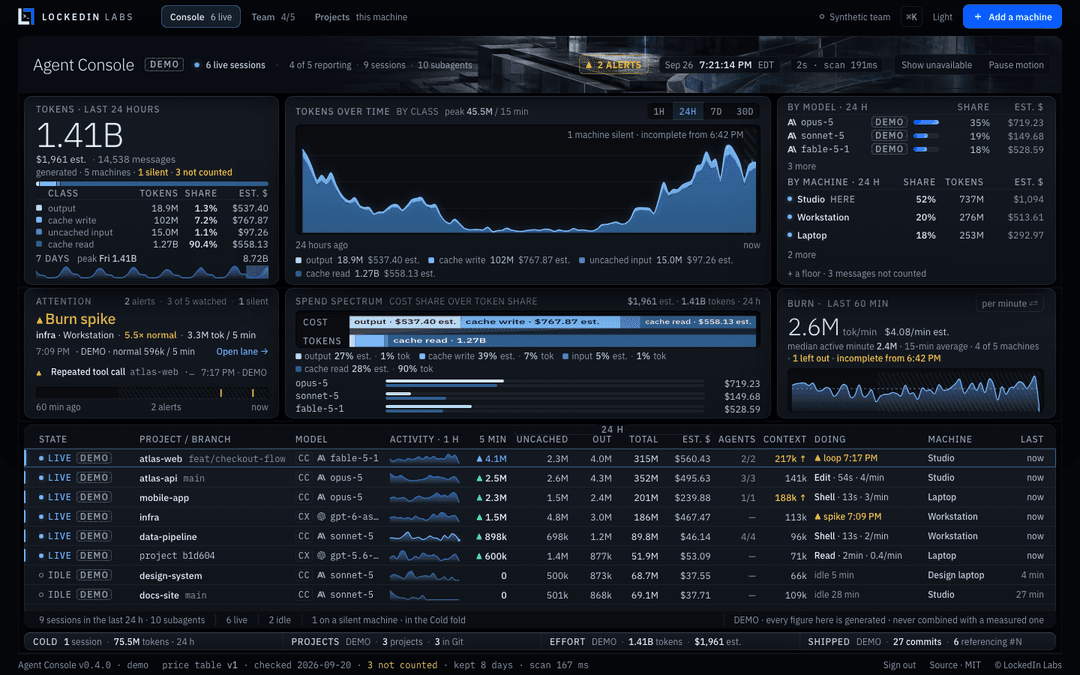
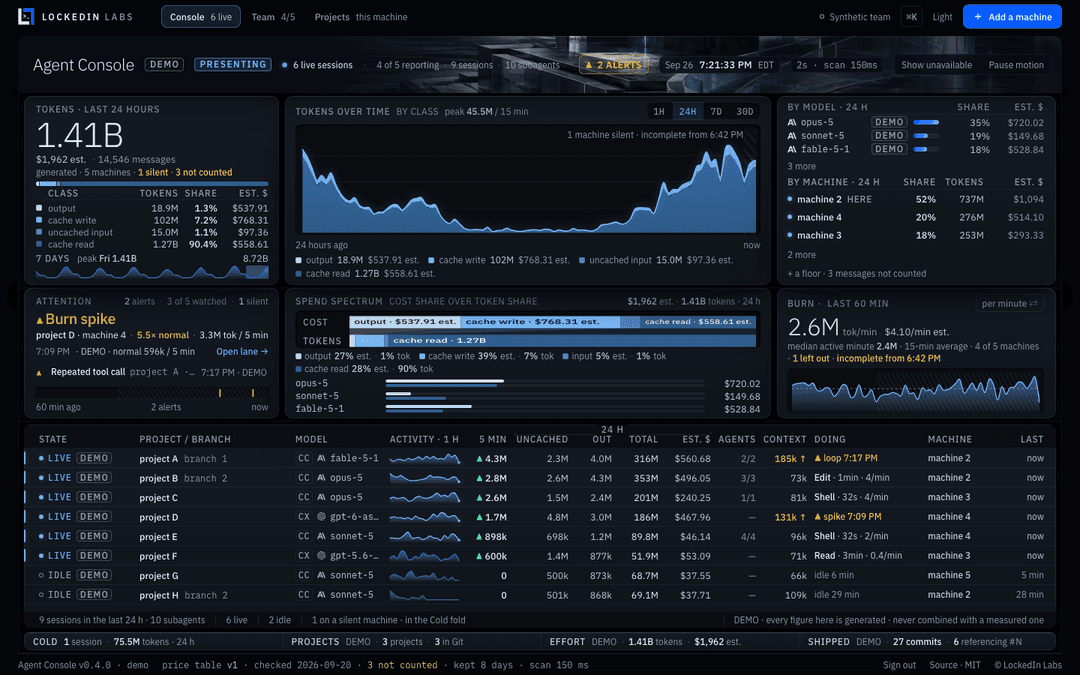
Captured from --demo. Every figure in it is generated and stamped DEMO.
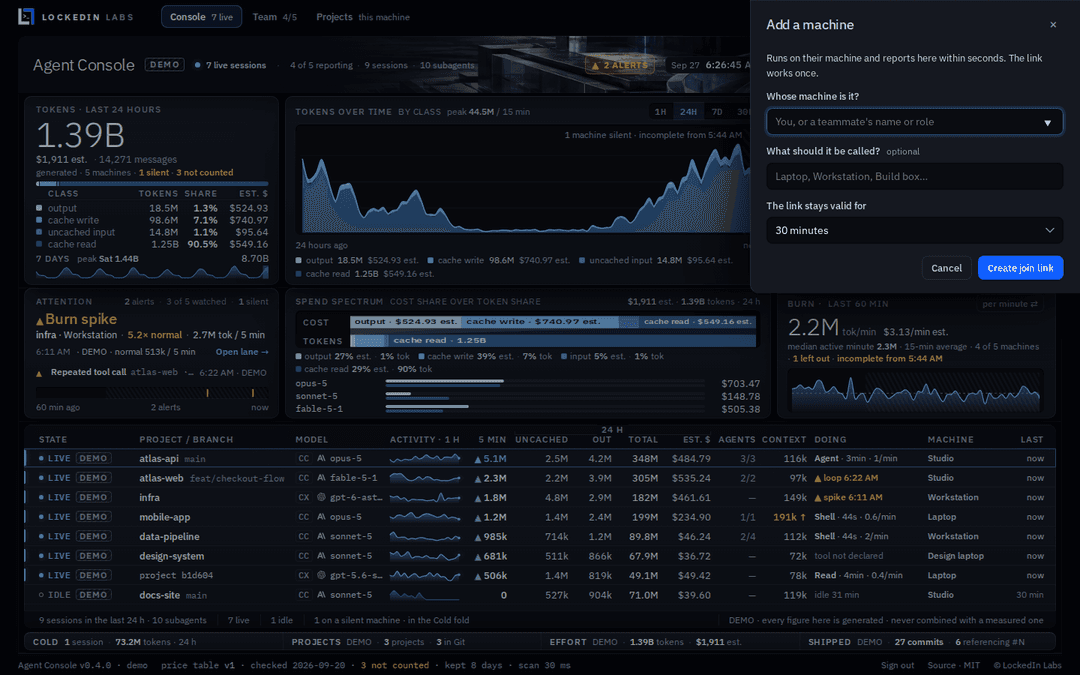
The same screen in the light theme.
npx --yes https://github.com/SamSnead85/agent-console/releases/download/v0.4.0/lockedinlabs-agent-console-0.4.0.tgz --open
You need Node.js 22 or newer. There is no account to create, nothing else to
install and no build step. The command fetches the packaged console from this
project's GitHub release, reads the Claude Code and Codex history already on
this computer, and opens the console in your browser, signed in, normally at
http://127.0.0.1:6787. To look around first without reading anything of
yours, add --demo before --open.
In the first thirty seconds you see: the last 24 hours of tokens (or the last hour, 7 days or 30 days), split into cache read, cache write, output and uncached input; their list-price estimate; burn right now, in tokens per minute and dollars per hour; one lane per session with its model, its subagents and its last hour of activity; and every machine and person reporting, each with a share of the total.
Nothing leaves a machine but counts. Only model ids, minute timestamps,
token counts and salted hashes, and never a prompt, a reply, a file path or a
file's contents. A test pushes transcripts full of planted canaries through
the real reporter and the real hub and checks every byte that crosses the wire.
The console itself sends nothing anywhere: no telemetry, no update check, no
account. (Three opt-ins, each off unless you pass it: --share-project-names
sends each project folder's name, never its path; --share-alerts and
--share-tool-activity send alerts and tool calls as kinds and counts.)
Start here
You need a Mac, a Linux machine or a Windows PC, and about two minutes.
-
Install Node.js 22 or newer. Get the LTS version from nodejs.org. To check, open a terminal (Terminal on a Mac, PowerShell on Windows) and type
node --version— it should sayv22or higher. No Node.js? Install the standalone executable instead. -
Start it. Paste this into the terminal and press Return:
npx --yes https://github.com/SamSnead85/agent-console/releases/download/v0.4.0/lockedinlabs-agent-console-0.4.0.tgz --openThat fetches Agent Console from this project's GitHub release (nothing to download by hand) and opens it in your browser, signed in, normally at
http://127.0.0.1:6787. If that port is taken, the terminal prints the address it used instead. Leave the terminal window open; closing it (or pressing Ctrl+C) stops the console. The same command starts it again.The first start reads the Claude Code and Codex history already on this computer. With months of it that can take a minute; the terminal counts the files as it goes, and so does the console.
No Node.js? Each release also carries one executable per platform with Node.js inside, and an installer that checks it before installing (docs/standalone-install.md). On a Mac or Linux:
curl -fsSLO https://raw.githubusercontent.com/SamSnead85/agent-console/main/install.sh && sh ./install.sh
On Windows, docs/standalone-install.md
has the PowerShell line (install.ps1). Both installers compare the
executable's SHA-256 with the release's SHA256SUMS line for it and install
nothing if it differs; then agent-console --open starts the console. The
files, and how to check one yourself, are under
Checking a download.
Or download it. On the GitHub page,
press the green Code button, then Download ZIP, and unzip it. You get a
folder called agent-console-main. In a terminal, go into that folder and
start the console:
cd ~/Downloads/agent-console-main
node bin/agent-console.mjs --open
On Windows (PowerShell) the first line is cd $HOME\Downloads\agent-console-main.
If node then says it cannot find bin/agent-console.mjs, Windows unzipped
the folder inside another one of the same name: run cd agent-console-main
once more. (If you use git: git clone https://github.com/SamSnead85/agent-console.git,
then cd agent-console.)
The .tgz on the release page. The releases page
lists a file named lockedinlabs-agent-console-<version>.tgz. It is the
packaged console that the one-line command above fetches for you. You don't
need to download or open it. Source code (zip) on the same page is that
release's code, used the same way as Download ZIP (its folder is named
agent-console-<version>).
The rest of this page writes commands as node bin/agent-console.mjs. If you
used the one-line command, put npx --yes <that release link> in its place.
Nothing to install beyond Node, no account, no build step, no dependencies.
To look around before it reads anything of yours:
node bin/agent-console.mjs --demo --open shows a synthetic team of five
machines. Everything on that screen is stamped DEMO.
Add another computer
A teammate's laptop, your second machine, a second user account on this one: each reports to the same console and they all add up.
-
Start the console so other computers on your network can reach it:
node bin/agent-console.mjs --listen 0.0.0.0 --openOther computers reach it on the next port (normally
6788); the console itself stays on this computer only (see How the machines connect). -
In the console, press Add a machine. Say whose machine it is and what to call it, press Create join link, then Copy command and send it to them. (Copy link is there too: the link opens a page with the same command.)
-
On the other computer, they paste that command into a terminal. It needs Node.js 22 or newer and nothing else. The command installs Agent Console from its GitHub release, never from your computer, and the join itself travels encrypted, checked against your console's certificate.
The machine appears on your console within seconds, and the console shows who joined and when. A join link works once, for at most an hour. On the screen the link and its code stay masked; Copy puts them on the clipboard.
Presenting. Press P (or choose Present in ⌘K) before sharing a screen:
every project, branch, machine and person becomes a stable stand-in name
(project A, machine 1), the estimates and the console's addresses step back,
and the strip reads PRESENTING. Press P again to stop.
Signing in
The console only shows its figures to a browser that has signed in. --open
opens it signed in. Otherwise the terminal prints a sign-in link when the
console starts; it works once. To sign in again later, for example in another
browser, run the start command again with --open: it sees the console is
already running and opens it signed in. Each browser gets its own session,
which lasts 30 days; Sign out, at the foot of the console, ends it.
What works where
| macOS | Linux | Windows | |
|---|---|---|---|
| The console, reading this computer | Yes | Yes | Yes |
| Joining and reporting to another computer's console | Yes | Yes | Yes |
| Projects view (Git evidence) | Yes, with git | Yes, with git | Yes, with git |
CI runs the whole test suite, including the multi-process privacy test, and the package smoke test on macOS, Linux and Windows, with Node 22 and 24.
Windows: use PowerShell, and when Windows asks whether Node.js may accept connections on the machine running the console, allow it on private networks.
What you see
Tokens · last 24 hours, or the last hour, 7 days or 30 days from the period switch: the total across every machine, the list-price estimate, the number of messages (API responses, not transcript lines), and the split into cache read, cache write (by cache lifetime), output and uncached input, each with its share of all tokens. The chart, the model list and the machine list follow the same period, and the chart's bars add up to the headline. 30 days come from daily totals the console keeps for 400 days. Transcript lines that carry usage but could not be counted are counted by reason and shown beside the figures, never silently dropped. (Cache read as a share of input tokens only, the other common reading, is in the cache-read tooltip, labelled as such.)
Tokens over time: the last hour, day, week or 30 days. Where a machine has stopped reporting, the chart says from when it is incomplete.
By model and by machine: each model's share and spend over the period, with real Anthropic and OpenAI marks, and each machine's share, tokens and estimate, one row each, a silent machine saying since when.
Attention: the one thing that needs it — a burn spike, spending without progress, a repeated tool call, an unpriced model in the estimate, a silent machine — or, when nothing does, that nothing does.
Spend spectrum: the estimate's share by class over the tokens' share by class, so a small share of tokens that is a large share of the money shows as such; then each model's share of the money over its share of the tokens.
Burn · last 60 min: tokens per minute (or per second) right now, averaged over the last fifteen minutes so one burst of agent traffic does not swing it, the dollars per hour it implies, and the last sixty minutes drawn one bar per minute with their median.
Lanes: one row per session: whether it is live, the project and branch, the model, its last hour of activity, tokens in the last five minutes, uncached input and output for the day, the day's tokens and their estimate, how many subagents it is running, its context, which machine it is on and when it last reported. The rest of the day folds under the lanes: cold sessions, projects, effort and what was shipped.
Context and cache health: the Context column shows the latest complete
input reading for an API response in each session. Open it to see the last 16
readings, growth, and possible cache breaks. A session is flagged when a
reading reaches 160,000 input tokens, or when it reaches 80,000 and doubles
from the first retained reading. The hub keeps at most 128 recent readings per
session. Streaming continuation rows are excluded, so some responses without
a complete first reading cannot be shown. A gap past the previous write's
known lifetime (five minutes or one hour), followed by a new cache write and
falling cache reads, is marked an idle-gap signal. With an unknown lifetime,
the drill-down says so; a large write within a known lifetime is marked a
possible prefix rewrite. The logs do not prove the cause. Extra cost is an estimate of the
observed cache write over a hypothetical cache read, using the offline price
table version and check date shown in the drill-down. Unpriced estimates stay
unknown. In --demo, the existing docs-site lane includes a synthetic break.
Optional telemetry and metrics
Start with --interop to enable a local Prometheus /metrics endpoint and
local ingest of Claude Code OpenTelemetry and Kong or LiteLLM token metrics.
The console shows those readings in a Telemetry panel, separate from the
transcript totals so the same request is never added twice. It is off for
ordinary users. The synthetic demo shows an OpenTelemetry reading. See
setup, accepted formats and privacy rules; the included
Grafana dashboard can read /metrics.
/metrics and ingest require separate credentials: metrics-token --scope read
for scrapers and metrics-token --scope ingest for exporters. Add --rotate
to revoke and replace one scope without restarting the console.
Shared analysis core
The dependency-free analysis functions are available to other Node.js consumers
through the versioned @lockedinlabs/agent-console/analysis subpath:
import { ANALYSIS_VERSION, contextHealth } from '@lockedinlabs/agent-console/analysis';
const health = contextHealth(samples, prices);
The package is not on the npm registry yet; install it from the release tarball with npm install https://github.com/SamSnead85/agent-console/releases/download/v0.4.0/lockedinlabs-agent-console-0.4.0.tgz.
ANALYSIS_VERSION is 1. contextHealth accepts only plain usage data:
samples contains timestamps, token counts and model IDs; prices contains
offline model rates, table version and check date. It returns a plain object
with context weight, growth, possible cache breaks and estimated extra cost.
No transcript text, paths, names or credentials enter the core. The console
uses this same subpath. See the API contract for fields
and unknown-value behavior.
Live alerts: as new local Claude Code or Codex transcript lines arrive,
Agent Console flags repeated identical tool calls, a response spending at least
50,000 tokens and three times its session's recent median, and 500,000 tokens
spent over five minutes without an observed successful tool result. A repeated
call needs five matching tool-and-argument hashes. These are signals, not proof
that work is stuck. The alert panel covers this machine; alerts remain local
and expire from the panel after an hour. --demo includes synthetic examples.
Use --alert-repeat, --alert-spike-factor, and --alert-stall-minutes to
change the thresholds. Add --desktop-alerts to opt in to native macOS,
Linux, or Windows notifications; they name the signal but never include tool
arguments. The existing collector tail checks for new lines every two seconds,
and the UI polls every two seconds. The alerts use the collector's counted
token deltas and salted session identities, including distinct subagents; they
do not rescan transcripts or recompute Codex usage. In a synthetic five-call
append through the local collector on this machine, the alert appeared after
2,043 ms; the next UI poll can add up to two seconds. That is an observation,
not a latency guarantee.
The pure detection rules are exported from the shared analysis subpath.
Agent tree: open the Agents count in a lane to see the orchestrator and its observed subagents in place. Each row shows its model, tokens observed in the last 24 hours, and the span between its first and last reported records. Outcome is unknown · no result recorded until a result is available in the privacy-safe record format; activity or a tool call is not treated as success. The synthetic team includes parent and child sessions. The same count-only tree builder is exported from the shared analysis subpath.
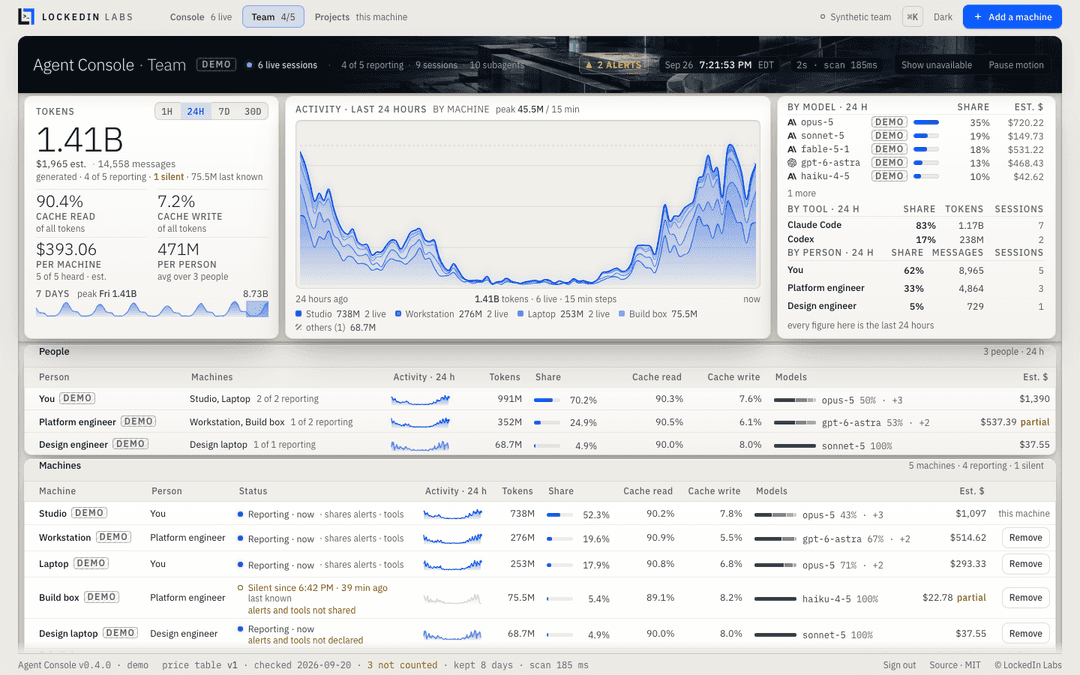
Team: every machine and every person: tokens, share of the total, cache read and write shares, model split and cost, for the same periods as the headline; every join link, who used it and when. Two machines with the same person roll up into one row.
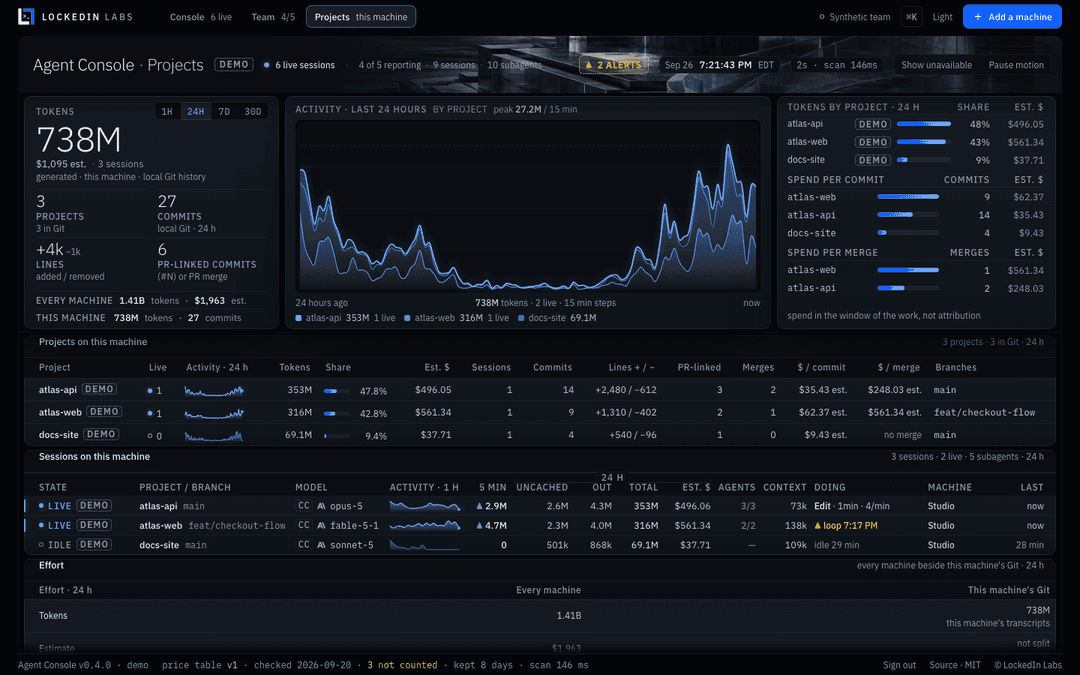
Projects: this computer only: tokens per project, and what Git recorded in
the same period (commits, lines changed, and commits referencing a pull request
or issue number). Git figures count only commits by this computer's Git email
(user.email); where none is set, the page says it counts every author. It is
read on this computer and never sent anywhere.
Spend in the window of the work: Projects also shows estimated spend per local commit and per integration into a locally known default branch. The denominator is Git evidence in the selected period (1 hour to 30 days); the numerator is this machine's usage estimate in that same window. These are correlations, not attribution to a commit or a merge. Squash subjects with a pull-request number and merge commits on the default branch count as integrations. A missing default-branch ref, zero outcomes or any unpriced usage leaves the ratio unknown, shown as a dash. No GitHub token or network request is involved. The synthetic team includes demonstration ratios.
What the numbers promise
- A machine that stops reporting is not zero. It shows when it was last heard from, its sessions show an unknown five-minute figure, and it is left out of "right now" by name.
- A machine still sending its history is not complete. A computer that joins with months of transcripts shows "catching up · N of M records" until everything has arrived, and is left out of "right now" until then. If its upload is interrupted it carries on from where it stopped.
- Unknown is not zero. A record that did not report a token class makes the total a floor, and the screen says so. A model with no verified list price is left out of the dollar figure, never priced at $0, and the screen says how many tokens that leaves out. If everything in the burn window is unpriced, the burn shows "—/hour · unpriced" rather than a dollar rate.
- Copied transcripts count once. Record ids come from the transcript itself, not from where the file sits, so the same session read on two machines is one set of events.
- Dollars are estimates at standard API list prices from a dated, offline
table (
lib/collector/prices.json). They are not an invoice and not a subscription charge. Tokens measure usage, not productivity. - Demo is never mixed with measured data. A console started with
--demoreads nothing, accepts no machine, and stamps DEMO on every view.
The full definitions are in docs/MEASUREMENTS.md. The accounting rules for people, teams, models and sessions, and the conformance suite that checks them to the token, are in docs/accounting.md.
Project policy
Add agent-policy.yaml at your repository root, then, from that root:
npx --yes https://github.com/SamSnead85/agent-console/releases/download/v0.4.0/lockedinlabs-agent-console-0.4.0.tgz policy diff
npx --yes https://github.com/SamSnead85/agent-console/releases/download/v0.4.0/lockedinlabs-agent-console-0.4.0.tgz policy apply
npx --yes https://github.com/SamSnead85/agent-console/releases/download/v0.4.0/lockedinlabs-agent-console-0.4.0.tgz policy remove
policy diff shows the proposed Claude Code agents, settings and hooks;
policy apply installs those project files with private backups; policy remove restores what was there before and deletes what apply created. From a
download, use node bin/agent-console.mjs policy …; policy --help prints the
usage. All three refuse a symlinked .claude path and never write your
user-level Claude settings. The installed hook decides within five seconds,
and asks or denies when it cannot classify a command in time. Nothing is
installed by starting the dashboard. The optional policy covers model roles,
effort, action gates, and budget thresholds; hard token and dollar budget
enforcement is not available from the native launch hook. See
the policy format and current enforcement limits.
How the machines connect
One computer runs the console: the hub. Every other computer runs a small reporter that reads its own Claude Code and Codex transcripts and sends the hub metadata every ten seconds.
  laptop ── reporter ──┐   TLS, pinned            ┌── the console: 127.0.0.1:6787, signed in
                       ├── reporting port 6788 ──> hub
  workstation ─ reporter ┘  (device token)         └── reads its own transcripts too
Two ports. The console, its data and every button on it (making links,
removing machines) are on 127.0.0.1:6787: this computer only, whatever
--listen says, and only for a signed-in browser. Other computers talk to the
reporting port, 6788, which serves only the join page, the join exchange and
reporting. By default it listens on this computer only; --listen 0.0.0.0 (or
a specific address) opens it to your network. It accepts callers on private
networks only (home and office ranges, IPv6 unique-local) unless you pass
--allow-public. Tailscale's addresses (100.64.0.0/10) are shared with
strangers on carrier-grade NAT, so they count only with --allow-cgnat. To look at the console from elsewhere, tunnel to it:
ssh -L 6787:127.0.0.1:6787 you@hub-computer, then open http://127.0.0.1:6787.
Encrypted and pinned. The console makes its own TLS certificate the first time it starts, and every join link carries that certificate's fingerprint. Joining and reporting go over TLS, and the reporter accepts only that certificate, so nobody on the network can read the reports or pose as your console. The join page itself opens as plain HTTP so a browser shows no warning, which is why the command is what you send: see SECURITY.md.
Credentials. A join link carries a single-use code that expires within the
hour (--invite-minutes, at most 60). The reporter spends it once and receives
its own device token, which it keeps in a private file (mode 600) under
~/.agent-console/reporter/. The token is never printed, never put in a URL and
never shown on a screen; the hub stores only a SHA-256 verifier of it. Remove
on the Team view revokes a machine at once (its reporter stops and says why),
and what it already reported stays, marked as removed.
Storage. The hub keeps 8 days of usage (--retention-days) in
~/.agent-console/hub/ (--state-dir), one file of metadata records per day.
Nothing leaves that directory.
The reporter
Add a machine gives the exact command, and so does the join page. Written out, with the release link:
npx --yes https://github.com/SamSnead85/agent-console/releases/download/v0.4.0/lockedinlabs-agent-console-0.4.0.tgz join '<join link>'
npx --yes https://github.com/SamSnead85/agent-console/releases/download/v0.4.0/lockedinlabs-agent-console-0.4.0.tgz report
npx --yes https://github.com/SamSnead85/agent-console/releases/download/v0.4.0/lockedinlabs-agent-console-0.4.0.tgz leave
join enrols this computer, then keeps reporting. report keeps reporting after
a restart, with no new link. stop stops a reporter running in the background
and keeps the enrolment. leave stops any reporter, tells the console this
computer has left, and deletes everything the enrolment left on this computer.
Joining the same console again keeps this computer's entry and history, rather
than adding a second machine with the same name; after leave, that holds when
the new link names the same person and machine. From a download, use node bin/agent-console.mjs in place
of npx --yes <release link>. Always use the full command: the short name on
its own would fetch a different, unrelated package from the public registry.
The command Add a machine gives, and the join page's, starts with
node -e '<check>': a short check that downloads the release file and its
SHA256SUMS from GitHub, runs nothing unless the file's SHA-256 matches,
keeps the checked file in ~/.agent-console/releases/, and then runs it.
Before running a command you were sent, compare its check with the published
one (The check in every command). The
reporter's own restart line names that checked file.
Options: --name (what to call this computer), --interval <seconds> (2 to
3600; over 60 the console shows it as reporting periodically), --background,
--once, --state-dir, --home, --claude-root, --codex-root,
--share-project-names, --share-alerts, --share-tool-activity, --json.
An unknown option is refused, not ignored.
Two more opt-ins, each off unless passed on that run, let the console see
more of this computer. --share-alerts sends the alerts it raises (repeated
tool call, burn spike, spending without a tool success) as a kind, a minute, a
salted session hash and one count; without it the console names this computer
as not watched rather than showing its silence as "no alert".
--share-tool-activity sends how many tool calls each session made per minute
by kind (read, edit, shell, search, web, agent, mcp, other) and how many results
were errors — never a tool's name, its arguments or output, a path, or an MCP
server's name. Every report says which of the two its run shares: run without
one and the console shows that computer's alerts or activity as unavailable
from then on, never as zero. What the console has not yet acknowledged waits
beside the reporter's cursor and is sent again, and counted once.
--background keeps reporting after the window closes. To start reporting at
every login, docs/BACKGROUND.md has launchd, systemd and
Task Scheduler examples.
Privacy, precisely
What leaves a reporting computer, per usage event: the tool (claude-code or
codex), the model id, the minute it happened, the four token counts, whether
it was a subagent and whether it continues a message already counted, and
HMAC-SHA256 hashes of the session, its parent and the project folder. Session
hashes are keyed by a salt the hub shares only with the machines that join it,
so a copied transcript is recognised; project hashes are keyed by a secret that
never leaves the reporting computer. The machine's name is whatever the
person who made the link typed (or --name when joining). With
--share-project-names on that run, also the last part of each project
folder's name, reduced to letters, digits and dashes; run without it and names
stop at once. With --share-alerts, each alert as a kind, a minute, a session
hash and a count; with --share-tool-activity, tool calls per minute counted
by one of eight kinds, and results counted as ok or error.
What never leaves: prompts, replies, thinking, tool input and output, file paths, file names, file contents, git branches, command lines, credentials.
On the hub's own computer the console also shows local project names and branches, read from its own disk, shown only to the signed-in console, never stored with the records and never sent anywhere.
The proof is test/hub-e2e.test.js: synthetic transcripts in the tools' real
formats, with canaries in every private field, go through a real reporter
process and a real hub process; a relay holding the hub's certificate records
every request in plain text, and the test checks the wire, the hub's files, the
reporter's files and the console's own payload for every canary. The
field-by-field contract is docs/COLLECTOR-CONTRACT.md.
Troubleshooting
The console opened on a port other than 6787. Another program had 6787,
so the console took the next free port and printed the address it used. If
Agent Console itself is already running there, a second start says so and
opens that one instead, once that console has proved it is yours (it never sends
it the console's key). A port you choose with --port is never changed: if
it is busy you are told to pick another.
The console says "Sign in to this console". Press Print a new sign-in
link on that page, and use the link that appears in the console's terminal
window. Running the start command again with --open works too.
The reporter says "the hub is pacing uploads" or "catching up". A computer joining with a lot of history sends it in batches, and the hub paces them. Leave the window open: every batch that arrived is kept, and the console shows the machine as "catching up · N of M records" until it is done.
The other computer cannot reach the console. Check, in order: the console
was started with --listen 0.0.0.0; both computers are on the same network
(not a guest network); the address in the link is still this computer's address
(it can change when you change networks, so make a new link); and the firewall
allows Node.js to accept connections on the reporting port. macOS asks the
first time (choose Allow; or System Settings → Network → Firewall → Options),
Windows asks the same (allow Private networks), and on Linux with ufw:
sudo ufw allow 6788/tcp.
"The machine at … is not the console that made this link." The certificate at that address is not the one named in the link: the link is for another console, or another machine is answering at that address. Nothing was sent. Ask for a new link.
"This join code is not valid" or "has expired." Each link works once, for at most an hour. Press Add a machine again and send the new link.
A machine shows "Silent since …". Its reporter stopped: the window was
closed, the computer slept, or it changed networks. On that computer run the
report command (the join page shows it), with no new link. If it says the hub
no longer accepts it, it was removed: send it a new link.
A machine shows "Reconnecting". The console restarted moments ago, and the machine was reporting when it stopped. Its reporter comes back within about a minute; nothing needs doing.
The console's reporting port changed. Reporters look for the console on
the ten ports either side of the one they joined on, and move by themselves.
Beyond that, start the console with --report-port set to the old port, or send
new links. A reporter that says the console's certificate changed has found a
different console at that address (or one set up again from scratch): send it
a new link.
A machine shows "Joined — waiting for its first report." It has joined but its reporter has not delivered yet; if it stays that way, the reporter window was closed right after joining.
The numbers look low. The console keeps 8 days, and the first start reads
only transcripts written in that window. Claude Code and Codex must be writing
their usual logs (~/.claude/projects, ~/.codex/sessions); if yours live
elsewhere, pass --claude-root / --codex-root.
npx or node is "not found". Node.js is not installed, or the terminal
was opened before it was. Install it from nodejs.org and open a new terminal.
Options
node bin/agent-console.mjs --help          # the console
node bin/agent-console.mjs join --help     # the reporter
| Console option | Default / purpose |
|---|---|
--open | open the console in the browser, signed in |
--port <n> | 6787: the console, on this computer only |
--report-port <n> | the port above it (6788): where other computers join and report |
--listen <address> | 127.0.0.1; 0.0.0.0 lets other computers reach the reporting port |
--allow-public | accept reports from outside private networks |
--allow-cgnat | also accept 100.64.0.0/10 (Tailscale, carrier-grade NAT) |
--demo | a synthetic team; reads nothing, accepts no machine |
--name <text>, --person <text> | this computer's name, and whose it is, on the console (This machine, You) |
--no-local | do not read this computer (a hub on a server) |
--state-dir <path> | ~/.agent-console/hub |
--retention-days <n> | 8 (1–90) |
--invite-minutes <n> | 30 (at most 60) |
--claude-root, --codex-root | where this computer's transcripts are |
--json | print launch details as JSON and keep running |
Environment equivalents use the AGENT_CONSOLE_ prefix.
Upgrading a hub
Stop its running console processes before upgrading. Keep each hub's state
directory on a local disk that supports hard links. One running hub owns a
state directory, even if another start chooses different ports; use a separate
--state-dir for a separate hub. Older versions must be stopped because they
do not honor the new ownership lock.
Checking a download
From 0.2.1 on, each release's package is built by CI from the release's tag.
The release page lists its SHA-256 in SHA256SUMS, and GitHub keeps a signed
build provenance attestation for it. To check a file you downloaded:
shasum -a 256 lockedinlabs-agent-console-0.4.0.tgz              # macOS, Linux
Get-FileHash lockedinlabs-agent-console-0.4.0.tgz               # Windows PowerShell
gh attestation verify lockedinlabs-agent-console-0.4.0.tgz -R SamSnead85/agent-console
The standalone executables (docs/executables.md) are
nine more files on the same page, each with its line in SHA256SUMS and the
same attestation: agent-console-darwin-arm64, agent-console-darwin-x64,
agent-console-linux-x64, agent-console-linux-arm64 and
agent-console-win32-x64.exe, and a .tar.gz of each of the first four.
Check one the same way, by its own file name.
The check in every command
Every command the console or the join page prints starts with
node -e '<check>': a short program that downloads the release file and the
release's SHA256SUMS from GitHub over HTTPS, and runs nothing unless the
file's SHA-256 is the one listed. Before you run a command someone sent you,
compare its check with the published one, not only its first words. The
check's SHA-256 is:
114422b34fdc2721cd70e125908fe2ef381b4afddf6c7317d3e540710ec03737
This command prints the SHA-256 of the check in any command you paste into it, without running anything. Paste the command, press Return, then Ctrl+D (Ctrl+Z and Return in PowerShell):
node -e "let s='';process.stdin.on('data',d=>s+=d).on('end',()=>console.log(require('crypto').createHash('sha256').update(s.split(String.fromCharCode(39))[1]).digest('hex')))"
The check itself, verbatim:
const[u,...a]=process.argv.slice(1),p=require(`path`),n=p.basename(u),g=x=>fetch(x).then(r=>{if(!r.ok)throw Error(x+` answered `+r.status);return r.arrayBuffer()}).then(Buffer.from);(async()=>{if(!/^https:[/][/]github[.]com[/][A-Za-z0-9_.-]+[/][A-Za-z0-9_.-]+[/]releases[/]download[/]v[0-9.]+[/][A-Za-z0-9_.-]+[.]tgz(?![^])/.test(u))throw Error(`not a release file: `+u);const t=String(await g(p.posix.dirname(u)+`/SHA256SUMS`)).split(/[^0-9A-Za-z._-]+/),b=await g(u),h=require(`crypto`).createHash(`sha256`).update(b).digest(`hex`);if(h!==t[t.indexOf(n)-1])throw Error(n+` does not match the release SHA256SUMS; nothing was run`);const f=require(`fs`),d=p.join(require(`os`).homedir(),`.agent-console`,`releases`),k=p.join(d,n),w=process.platform==`win32`,q=String.fromCharCode(34);f.mkdirSync(d,{recursive:true});f.writeFileSync(k,b);console.error(n+` matches the release SHA256SUMS: `+h);const r=require(`child_process`).spawnSync(w?[`npx`,`--yes`,`file:`+k,...a].map(x=>q+x+q).join(` `):`npx`,w?[]:[`--yes`,`file:`+k,...a],{stdio:`inherit`,shell:w,env:{...process.env,AGENT_CONSOLE_PACKAGE:k}});process.exit(r.status??1)})().catch(e=>{console.error(String(e.message));process.exit(1)})
Development
See the architecture and trust boundaries for data flow, component ownership and the CI/release path.
npm test               # the whole suite, including the multi-machine end-to-end tests
npm run smoke:pack     # pack, install into a scratch prefix, start it in demo mode
No dependencies to install. CI runs both on macOS, Linux and Windows, Node 22 and 24. See CONTRIBUTING.md (including the privacy rule every change keeps) and CHANGELOG.md. Report security problems privately, as SECURITY.md describes. Everyone taking part agrees to the Code of Conduct.
License
MIT © 2026 LockedIn Labs (LICENSE, PROVENANCE.md).
IBM Plex is included under the SIL Open Font License 1.1
(public/fonts/LICENSE-OFL.txt). Every bundled third-party asset is listed in
THIRD_PARTY_NOTICES.md.
Trademarks
The MIT licence covers the code. It does not grant rights to the LockedIn Labs name or marks: you may say that your work uses or is based on Agent Console, but a modified version must not be presented as a LockedIn Labs product or use its marks as its own. The Anthropic and OpenAI marks belong to their owners and appear only to identify their models.
About LockedIn Labs
Agent Console is built and maintained by LockedIn Labs.
// faq
What is agent-console?
Local observability for Claude Code and Codex. Sessions, subagents, tokens, model costs, and delivery evidence in one console.. It is open-source on GitHub.
Is agent-console free to use?
agent-console is open-source under the MIT license, so it is free to use.
What category does agent-console belong to?
agent-console is listed under devtools in the Claudeers registry of Claude-compatible tools.
// embed badge

[](https://claudeers.com/agent-console)
// retro hit counter

[](https://claudeers.com/agent-console)
// reviews
// guestbook
// related in Developer Tools
 🔓
🔓The agent harness performance optimization system. Skills, instincts, memory, security, and research-first development for Claude Code, Codex, Opencode, Curs…
 🔓
🔓Makes your AI agent think like the laziest senior dev in the room. The best code is the code you never wrote.
 🔓
🔓Use Garry Tan's exact Claude Code setup: 23 opinionated tools that serve as CEO, Designer, Eng Manager, Release Manager, Doc Engineer, and QA
 🔓
🔓AI coding assistant skill (Claude Code, Codex, OpenCode, Cursor, Gemini CLI, and more). Turn any folder of code, SQL schemas, R scripts, shell scripts, docs,…